Enterprise L&D teams manage hundreds of training requests, dozens of active projects, and limited team capacity. Without clear analytics, you’re flying blind.
The problem isn’t a lack of data. Most teams have a lot of data in their learning management system, project management tools, and spreadsheets. The problem is that this data lives in separate systems and is unstructured. Stitching it all together manually is difficult and time consuming. And by the time that’s done, the data is already outdated.
This scattered approach creates three problems:
- You can’t see operational bottlenecks until they cause delays. When training request data sits in email threads and project updates live in Slack, you can’t answer “How many requests are in review?” or “Which programs are at risk of delay?”
- You waste time building reports instead of improving programs. L&D managers often spend hours each week pulling data for different audiences. Each stakeholder meeting requires a new version of the same data.
- You can’t prove value to executives who control your budget. When senior leaders ask about ROI, you explain what your team delivered. But without metrics that link training demand to delivery to outcomes, you can’t show how L&D work connects to strategic priorities.
Enterprise learning & development teams need analytics that show training demand, project status, team capacity, and outcome signals in one place. Not just course completion rates or learner satisfaction scores. Those matter, but they don’t help you manage operations for the L&D function or prove value to the CFO.
This article reviews the five best L&D platforms for analytics and reporting in 2026. We focus on tools that help you run operations, report to executives, and make decisions backed by real data.
Cognota
Many L&D managers build reports in Excel templates and slide decks. They take numbers from LMS exports, project management tools, and email threads every time a leader asks for an update.
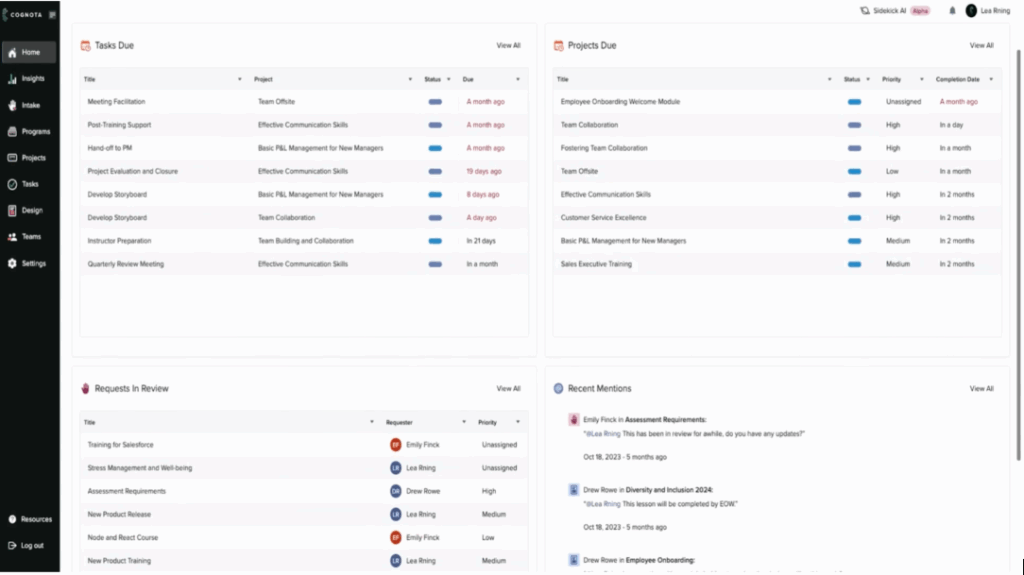
With Cognota, you can see training demand, project progress, team capacity, and portfolio health in one place. Cognota’s LearnOps platform connects intake, projects, resources, programs, and designs in one system. Our software helps enterprise L&D teams at companies with 5000+ employees plan their work, spot risks earlier, and give executives updates on how learning initiatives are performing.
Here’s what you can track with Cognota’s analytics and reporting features:
Demand Analytics (Intake)
Without intake and training analytics, L&D teams operate reactively. Training requests come through email, Slack, and hallway conversations. You don’t know how many are waiting, which ones matter most, or where bottlenecks are occurring. You’re flying blind.
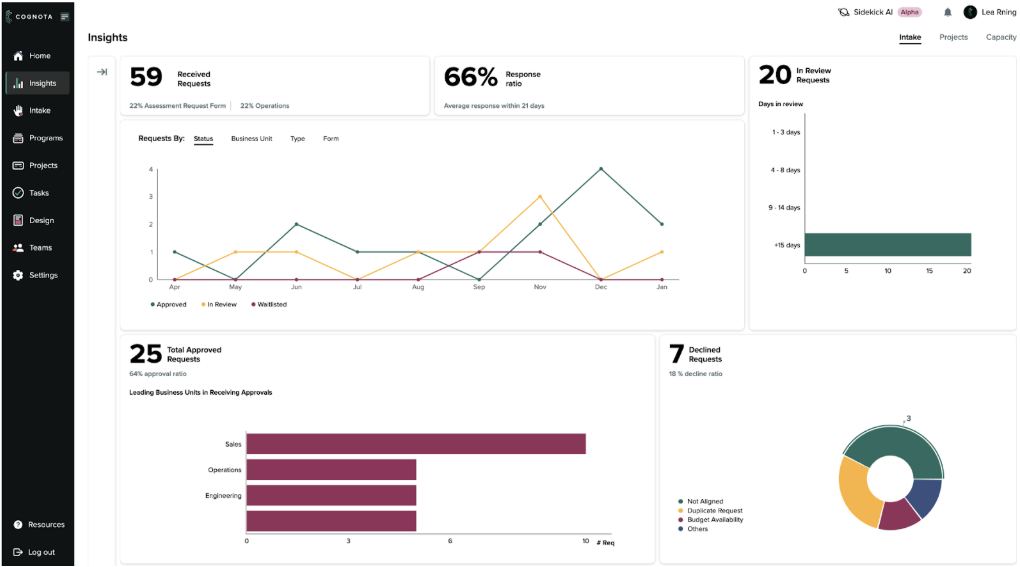
Cognota’s standardized intake system for training requests creates structured data that makes operations easier for L&D teams. You see demand patterns, approval speed, backlog health and more in one dashboard.
You can track:
- Total number of requests in a time period
- Response ratio and average response time
- How many requests are still in review, and for how many days
- Requests by status (approved, in review, waitlisted, declined)
- Approved requests by business unit
- Declined requests by reason, such as not aligned or duplicate
You can filter by date range, request owner, business unit, request type, or form. No spreadsheet exports needed.
For example, an L&D manager looking at the dashboard might see that safety training requests sit in review for 14+ days while other requests move faster. They can surface this data internally to figure out what is causing the delay and make operational changes to address it.
Delivery Analytics (Projects)
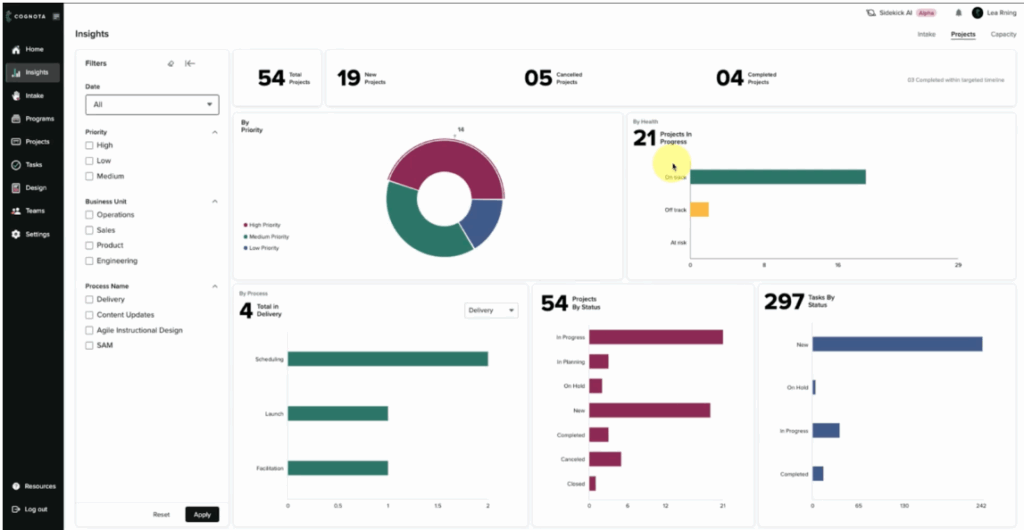
When project data lives in different tools, L&D leaders can’t see which learning initiatives are on track, at risk, or blocked. Cognota’s project analytics bring delivery data into one view so you can review progress without chasing updates. You can see:
- Total active projects in a given time frame
- Projects by status, priority, and owner
- Project health by phase or program
- Tasks by status, including overdue items
Filters let you focus on specific teams, business units, programs, or dates so each review is grounded in real numbers.
For example, if an L&D director needs to prepare for a monthly governance meeting, they can filter the dashboard to show compliance projects owned by regional teams. If three projects show poor health with multiple overdue tasks, those items go straight onto the agenda with owners and blockers already identified. No follow-up emails needed.
Capacity Analytics To Match Work With Available Hours
When L&D leaders can’t see capacity, teams overcommit and deadlines slip.
Cognota’s capacity analytics show you exactly where your team stands. You can see:
- Number of people on the team
- Total demand hours, capacity hours, actual hours, available hours, and allocated hours
- A trend line for demand vs capacity vs availability across the year
- Overall utilization and utilization by team
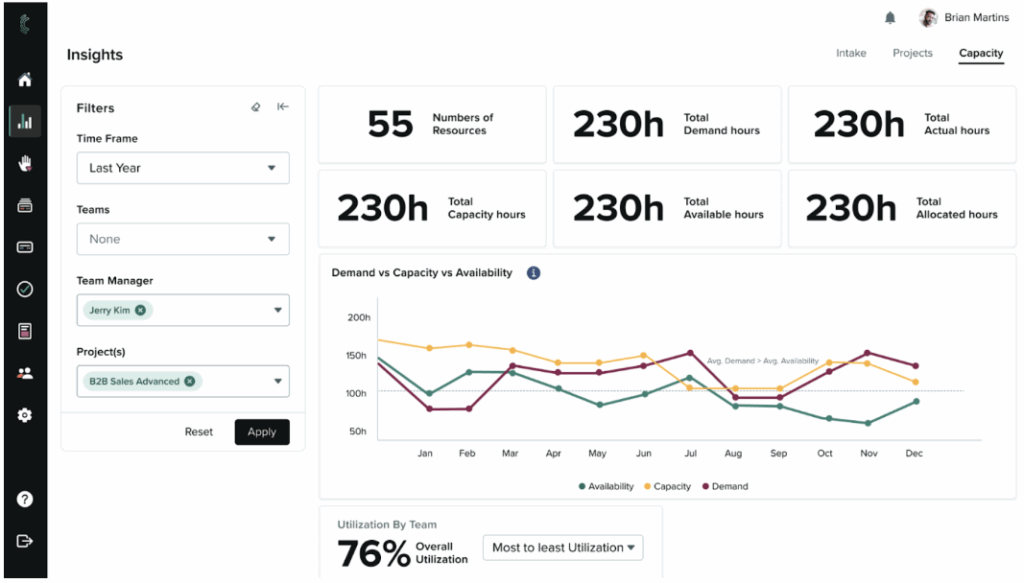
You can filter by team, manager, or project to see where work is piling up and where bandwidth remains.
For example, before planning next quarter, an L&D operations lead reviews capacity data from last year for one sales enablement manager. The dashboard shows demand hours exceeded availability for three months straight and utilization stayed above 85 percent. This data helps them redistribute work before the team burns out.
Portfolio Analytics To Track Programs And Initiatives
When you only track single projects, it is hard to answer simple questions like “How is our sales enablement program doing overall?” or “Which initiatives are at risk by region?”
Cognota’s portfolio analytics group related projects into one view. L&D leaders can review entire initiatives and report progress to executives without rebuilding dashboards from scratch.
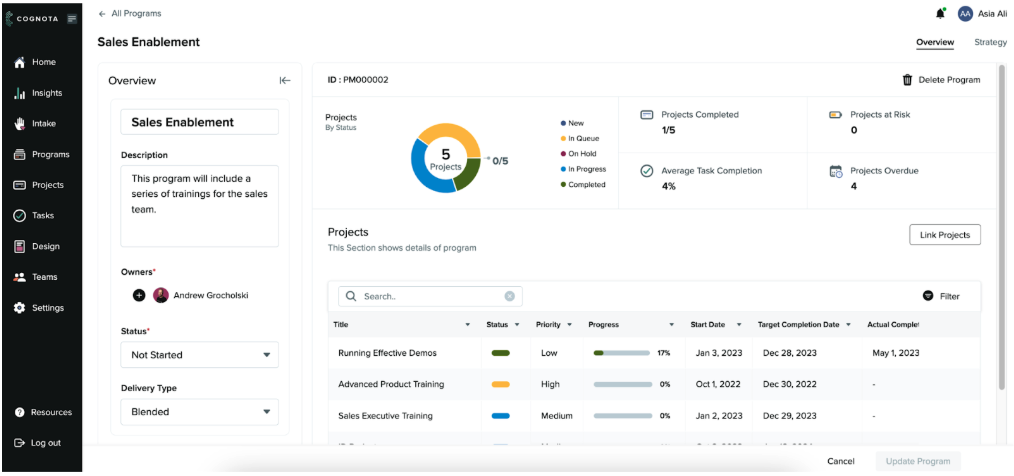
In a program workspace you can see:
- Total number of projects and a chart of projects by status
- Projects completed, projects at risk, and projects overdue
- Average task completion across the whole program
- A table of each project with status, priority, progress bar, start date, target date, and actual completion date
- Program basics such as title, description, delivery type, and owner
Program owners receive alerts when linked projects change. This means they review current data before every Quarterly Business Review, not outdated snapshots.
For example, an L&D director managing a global facilitation program opens the portfolio view and sees 17 linked training events across three regions. Eight events are completed, three are in progress, and six facilitator assignments are overdue in the APAC region.
The dashboard shows utilization rates are below 70 percent in that region while North America is above 90 percent. She uses this view in the leadership meeting to justify redistributing facilitators and adjusting the event schedule before conflicts cascade.
Timeline and Gantt Views for Delivery Reporting
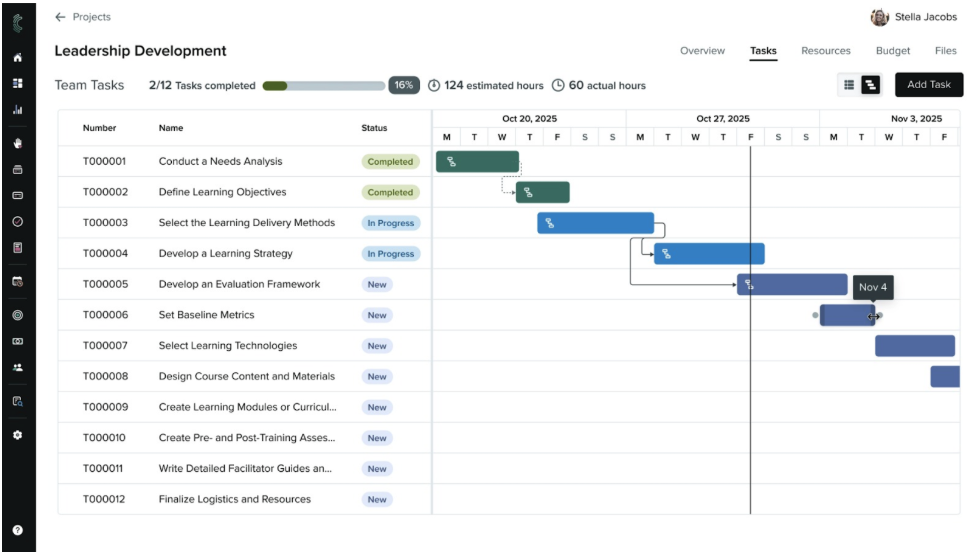
When project timelines sit in slide decks or spreadsheets, L&D leaders spot delivery risks too late. It becomes hard to explain what is on track, what is slipping, and why. Cognota’s Gantt view gives each project a live timeline so you can report dates, dependencies, and progress in one place.
You can:
- See every task on a weekly timeline, ordered by start date
- Read status at a glance through color-coded task bars
- Compare estimated and actual hours at the top of the screen
- Spot overdue work and upcoming milestones in the same view
- Drag tasks to move dates or extend duration when plans change
- Create and view dependencies between tasks so blockers are clear
- Schedule unscheduled tasks directly from the timeline
For example, before a leadership development steering meeting, an L&D manager opens the Gantt view for that program. They see two content tasks slipping past the target go-live date and one dependency that blocks assessment design. They adjust dates, capture the updated chart, and walk stakeholders through the impact and recovery plan.
AI Features for Faster L&D Decisions
Cognota’s LearnOps AI adds a conversational layer on top of this data so you can get answers in seconds instead of juggling through reports. It helps you see trends, spot risks, and explain decisions to senior leaders.
You can:
- Ask questions about demand, projects, capacity, and programs and get instant answers
- Find patterns in requests, approvals, and decline reasons to guide intake and prioritization
- See where hours, vendors, and budget sit across programs to support cost and ROI discussions
- Generate short summaries you can reuse in status emails, QBR decks, and leadership updates
For example, an L&D director can ask the AI assistant, “Show me the programs with the most overdue projects this quarter and why?” AI returns a ranked list with key drivers, such as missing SMEs or over-capacity designers. The L&D director uses this summary in the weekly review meeting to adjust priorities and protect critical launches.
Other Key Features
Beyond reporting, Cognota also gives enterprise L&D teams the core tools to run day-to-day operations in one place. Key features include:
- Centralized training intake with configurable request forms
- Project templates and life cycles for L&D work
- Authoring tool for structured course design
- Standardized course templates for brand and quality control
- Task management with owners, dates, and effort tracking
- Resource and budget fields inside each project record
- Program view to group projects by initiative
- Collaboration with business users, SMEs, and vendors
- LearnOps community, learning center, and CLLO coaching support
Cognota Pricing
Cognota offers custom pricing based on your business’s needs.
How a Fortune 100 Company Used Cognota Analytics to Manage 300+ Projects
A Fortune 100 insurance company operates one of the largest enterprise learning and development ecosystems in the industry. With five distinct learning centers, over 300 active projects, and thousands of learners globally, their L&D organization needed analytics to manage operations at scale.
The L&D Analytics Gap
The L&D team relied on disconnected tools including SAP, Workday, email, and Smartsheet to manage learning operations. Without centralized analytics, they faced three critical problems:
No demand or capacity visibility. Learning requests came through informal channels with no tracking. The team couldn’t see how many requests were waiting, forecast capacity, or assess backlog load. They operated reactively instead of using data to prioritize strategically.
“We had to support dynamic intake, weigh resource availability against initiatives and strategic goals, and ruthlessly prioritize. Our legacy tools just didn’t provide any of those mechanisms,” the team explained.
No project-level reporting. Without standardized tracking, each learning center managed projects differently. Leadership couldn’t see which projects were on track, at risk, or blocked. This led to missed deadlines and difficulty coordinating instructional designers and SMEs.
No portfolio analytics for executives. Leadership couldn’t answer basic questions about what projects were in flight, where capacity constraints existed, or which initiatives aligned with business priorities. Manual tracking made reporting time-consuming and data unreliable.
The Solution
In June 2024, the company deployed Cognota’s analytics and reporting platform to gain operational visibility across all five centers. The implementation included:
- Demand analytics through structured intake to capture and track every learning request with approval status, response times, and backlog health
- Project analytics with real-time tracking to monitor 300+ active projects by status, priority, health, and owner across all centers
- Capacity analytics and forecasting to match demand against available resources and prevent team overcommitment
- Portfolio-level reporting for executive visibility into program health, resource allocation, and strategic alignment
The team completed the rollout by Q4 2024, migrating all 300+ in-flight projects and training users across five centers without disrupting ongoing work.
“We were able to migrate and populate all of that in-flight work and train all of our users across the five centers. That was a pretty aggressive timeline,” they noted.
The Impact
Real-time capacity forecasting replaced reactive planning. The team now uses capacity data to make go/no-go decisions on new requests. They can forecast resource needs, manage backlogs proactively, and prioritize based on capacity analytics instead of urgency alone.
“We didn’t have capacity forecasting before, but now we have the data to say what’s possible, what isn’t, and how to prioritize.”
Standardized delivery analytics improved speed and consistency. With project analytics showing task status, timelines, and bottlenecks across centers, the team reduced variation and coordination time. Repeatable templates and tracking helped new initiatives onboard faster.
“We created an organizational model. We were able to bundle tasks and deliverables into programs and manage them in a much more concise way.”
Portfolio analytics gave leadership decision-grade data. Leadership can now track project status, resource allocation, and program health in one analytics dashboard. This supports strategic planning, budget conversations, and aligning learning investments with business priorities.
The company is now using these analytics insights to support their transition to xAPI-driven learning and a new enterprise LXP strategy.
Metrics That Matter (MTM)
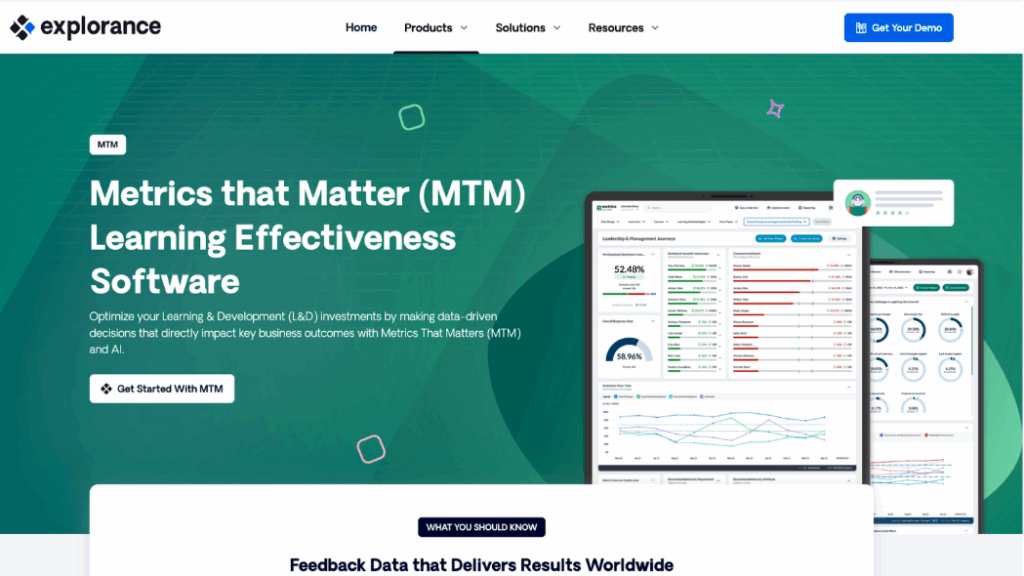
Metrics That Matter is an L&D measurement platform for enterprise teams that need stronger evidence of impact. It pulls evaluation data from your learning systems, standardizes it, and turns it into dashboards and reports for L&D teams and executives.
Instead of building survey templates and decks yourself, you can use MTM’s validated questionnaires, KPIs, and benchmarks to show if programs are relevant, effective, and tied to business priorities.
Key Features
- Standardized learning evaluation surveys and templates
- Dashboards for L&D, business, and executives
- Benchmarks to compare programs across industries
- Integrations with LMS and HR systems
- Analytics to flag low-impact learning programs
- Automated reports sent to key stakeholders
Pricing
Metrics That Matter offers custom pricing.
Docebo
Docebo is an AI-powered LMS used by large organizations to manage formal learning, skills, and compliance at scale. Its analytics modules and Learn Data product help L&D teams track usage, compare audiences, and feed cleaned learning data into BI tools for deeper impact analysis.
Key Features
- Dashboards for enrollments, completion, and engagement
- Skills and certification tracking reports
- Filters for courses, catalogs, and programs
- Learn Data export to enterprise BI tools
- Trend and forecasting views on learning data
- Scheduled reports for managers and executives
Pricing
Docebo offers two custom pricing plans, Elevate and Enterprise.
Administrate
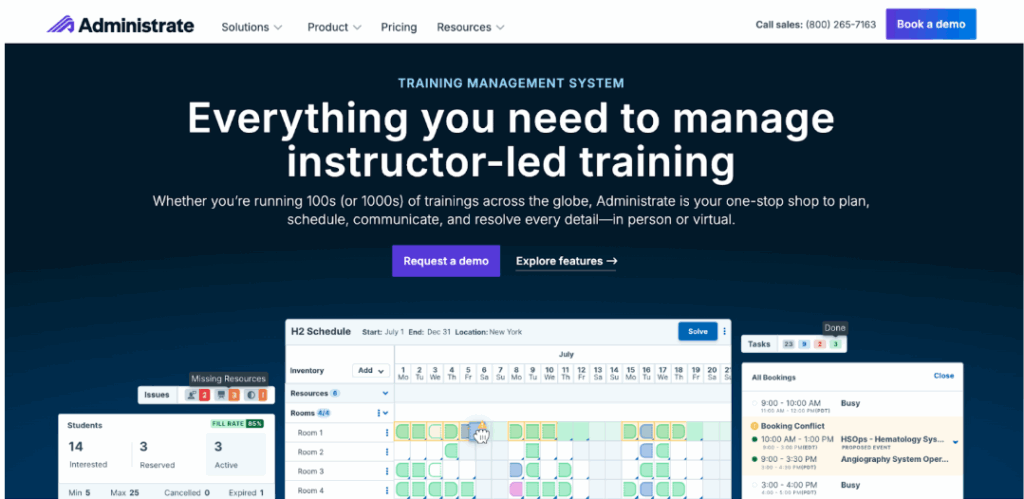
Administrate is an enterprise training management platform focused on instructor-led and virtual instructor-led training. It replaces separate tools with one system for scheduling, resources, finance, and reporting. L&D managers can use its reporting engine to track revenue, utilization, and program performance across regions and systems.
Key Features
- Central hub for instructor-led training (ILT) and virtual instructor-led training (vILT) scheduling
- Reporting engine for training revenue and performance
- Resource utilization reports for rooms and equipment
- Instructor workload and availability visibility
- Conflict alerts when resources are overbooked
- Integrations with ERP, HRIS, and finance tools
Pricing
Administrate offers three custom pricing plans: Essentials, Essentials Plus, and Enterprise.
Asana
Asana is a project management platform that many L&D teams use to track training projects, tasks, and timelines. While it’s built for general project management, smaller L&D teams can adapt it to manage learning initiatives across onboarding, compliance, and sales enablement programs.
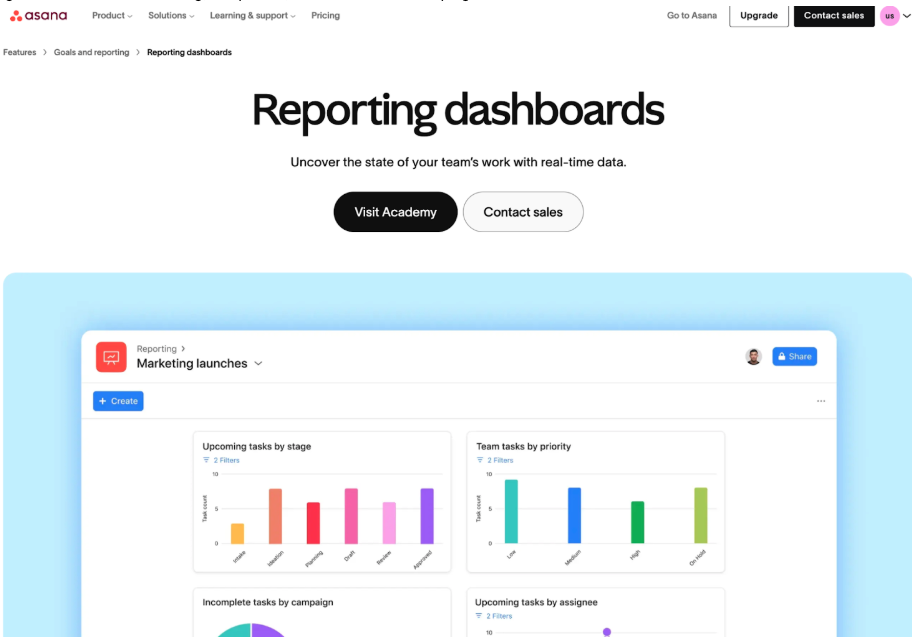
Its strength for L&D analytics lies in portfolio dashboards that roll up project status, workload views that show team capacity, and custom reporting across multiple programs. Because Asana isn’t purpose-built for learning operations, teams need to configure custom fields, workflows, and reports to make it work for L&D-specific use cases like intake prioritization or training demand forecasting.
Key Features
- Portfolio dashboards for program and project status
- Universal reporting across projects, teams, and tasks
- Workload view to spot overload by person or role
- Custom charts using custom fields and dates
- Timeline view to see schedule risk early
- Goals tracking connected to projects and portfolios
- Integrations with tools like Tableau and Power BI
Pricing
Asana offers a free tier. Paid plans start from $13.49 per user per month.
Summary Table: Best L&D Platforms for Analytics and Reporting in 2026
Software | Best For | Key Strength |
Cognota | Enterprise L&D teams (5,000+ employees) that want a complete operating system | End-to-end visibility from intake to capacity to portfolio analytics |
Metrics That Matter | L&D teams that need training evaluation and benchmarking | Standardized post-training surveys with industry benchmarks |
Docebo | L&D teams that don’t have an existing LMS | LMS analytics with AI-powered insights and BI tool integration |
Administrate | Teams managing instructor-led and virtual instructor-led training | Training revenue tracking and resource utilization for ILT/vILT |
Asana | L&D teams at SMBs or mid-market companies | Portfolio dashboards and workload views across multiple programs |
3 Types of L&D Analytics That Drive Decisions
There are three main types of analytics and reporting in learning and development:
Operational Analytics
Operational analytics show how work moves through your L&D team and where it slows down. These metrics help you manage workload, spot bottlenecks, and report delivery progress to stakeholders.
Key metrics include:
- Incoming requests by business unit or type
- Time from request to delivery
- Backlog size by status
- Project status and health
- Resource allocation and capacity by role
- Work mix across programs and priorities
In most enterprises, this data is scattered across intake tools, project trackers, and spreadsheets. This makes it nearly impossible to answer basic questions like which business units create the most demand, where work stalls, or which projects are at risk.
Learning Analytics
Learning analytics track how employees engage with training content and how well they perform. These metrics help you identify which programs drive engagement and which need improvement.
Key metrics include:
- Enrollments, completions, and time spent
- Assessment scores and pass rates
- Usage by format, topic, or channel
- Engagement by role, region, or manager
These metrics typically come from your LMS, LXP, and virtual classroom tools. They show which courses employees complete, where they drop off, and which content needs updates or retirement.
Outcome Analytics
Outcome analytics connect learning activity to business results. These metrics help you prove ROI and show executives how training supports strategic goals.
Key metrics include:
- Training linked to strategic initiatives or OKRs
- Behavior change or skill growth signals
- Compliance status by audience and region
- Impact on KPIs like sales ramp time, quality scores, or safety incidents.
Types of L&D Analytics and Reporting Platforms
There are five main types of L&D analytics platforms. Each one focuses on a different part of your work:
- LearnOps and Operational Analytics Platforms: Show training demand, project status, team capacity, and portfolio mix so you can explain workload and delivery to leaders.
- LMS and LXP Analytics Suites: Report on course usage, completions, assessments, and learner behavior inside your learning platforms.
- Assessment and Skills Analytics Platforms: Measure skills, test performance, and certification status across roles, teams, and programs.
- Knowledge Analytics Tools: Track how employees search, view, and use knowledge articles, job aids, and internal content.
- Analytics and BI Layers: Extract data from systems like LearnOps, LMS, HR, and CRM into one place for custom dashboards and executive reports.
How to Choose an L&D Platform for Analytics and Reporting
Here’s how to choose the right L&D software supporting analytics and reporting features:
Start With The Decisions You Need To Support
Before you pick a platform, list the real questions you need to answer. For most enterprise L&D teams, this includes:
- What is in our intake queue and who owns it
- Which projects and programs are at risk
- How full is our team capacity by role and by week
- Which audiences are underserved
- Which programs support specific business goals
A platform like Cognota makes these questions easy to answer.
Check Data, Integration, And Governance
Strong analytics depend on clean, connected data. Before you choose a platform, confirm how it will work with your current stack.
Look for:
- Connectors or exports for your LMS, HR systems, and project tools
- Clear rules on who owns data definitions and filters
- Ability to export data to your BI tools without custom work each time
Make sure the platform can show how metrics are built. L&D managers should be able to see how a number is calculated, not just look at a static chart.
Also check that the tool supports role-based access, so executives see portfolio and outcome views, while project owners see detail on their work.
Bottom Line: Cognota is the Best L&D Platform for Analytics and Reporting
Most learning tools focus on course metrics like enrollments and completions. That’s great for measuring training content, but it does not show how training requests, projects, capacity, and programs move through your learning and development function. That gap makes it hard to run an enterprise L&D team and explain workload, risk, and impact to executives.
Cognota connects demand, project status, capacity, programs, and analytics in one place. L&D managers can see what is in review, what is at risk, where the team is overloaded, and how work aligns to key initiatives.
If you want to stop chasing updates across spreadsheets and start reporting L&D operations with confidence, book a demo with Cognota. We’ll show you how enterprises like Delta Community Credit Union, Sun Life, and Americo use our LearnOps platform’s analytics to track demand, manage capacity, and prove ROI.