Features Include:
Data | Insights | Reporting | Benchmarks


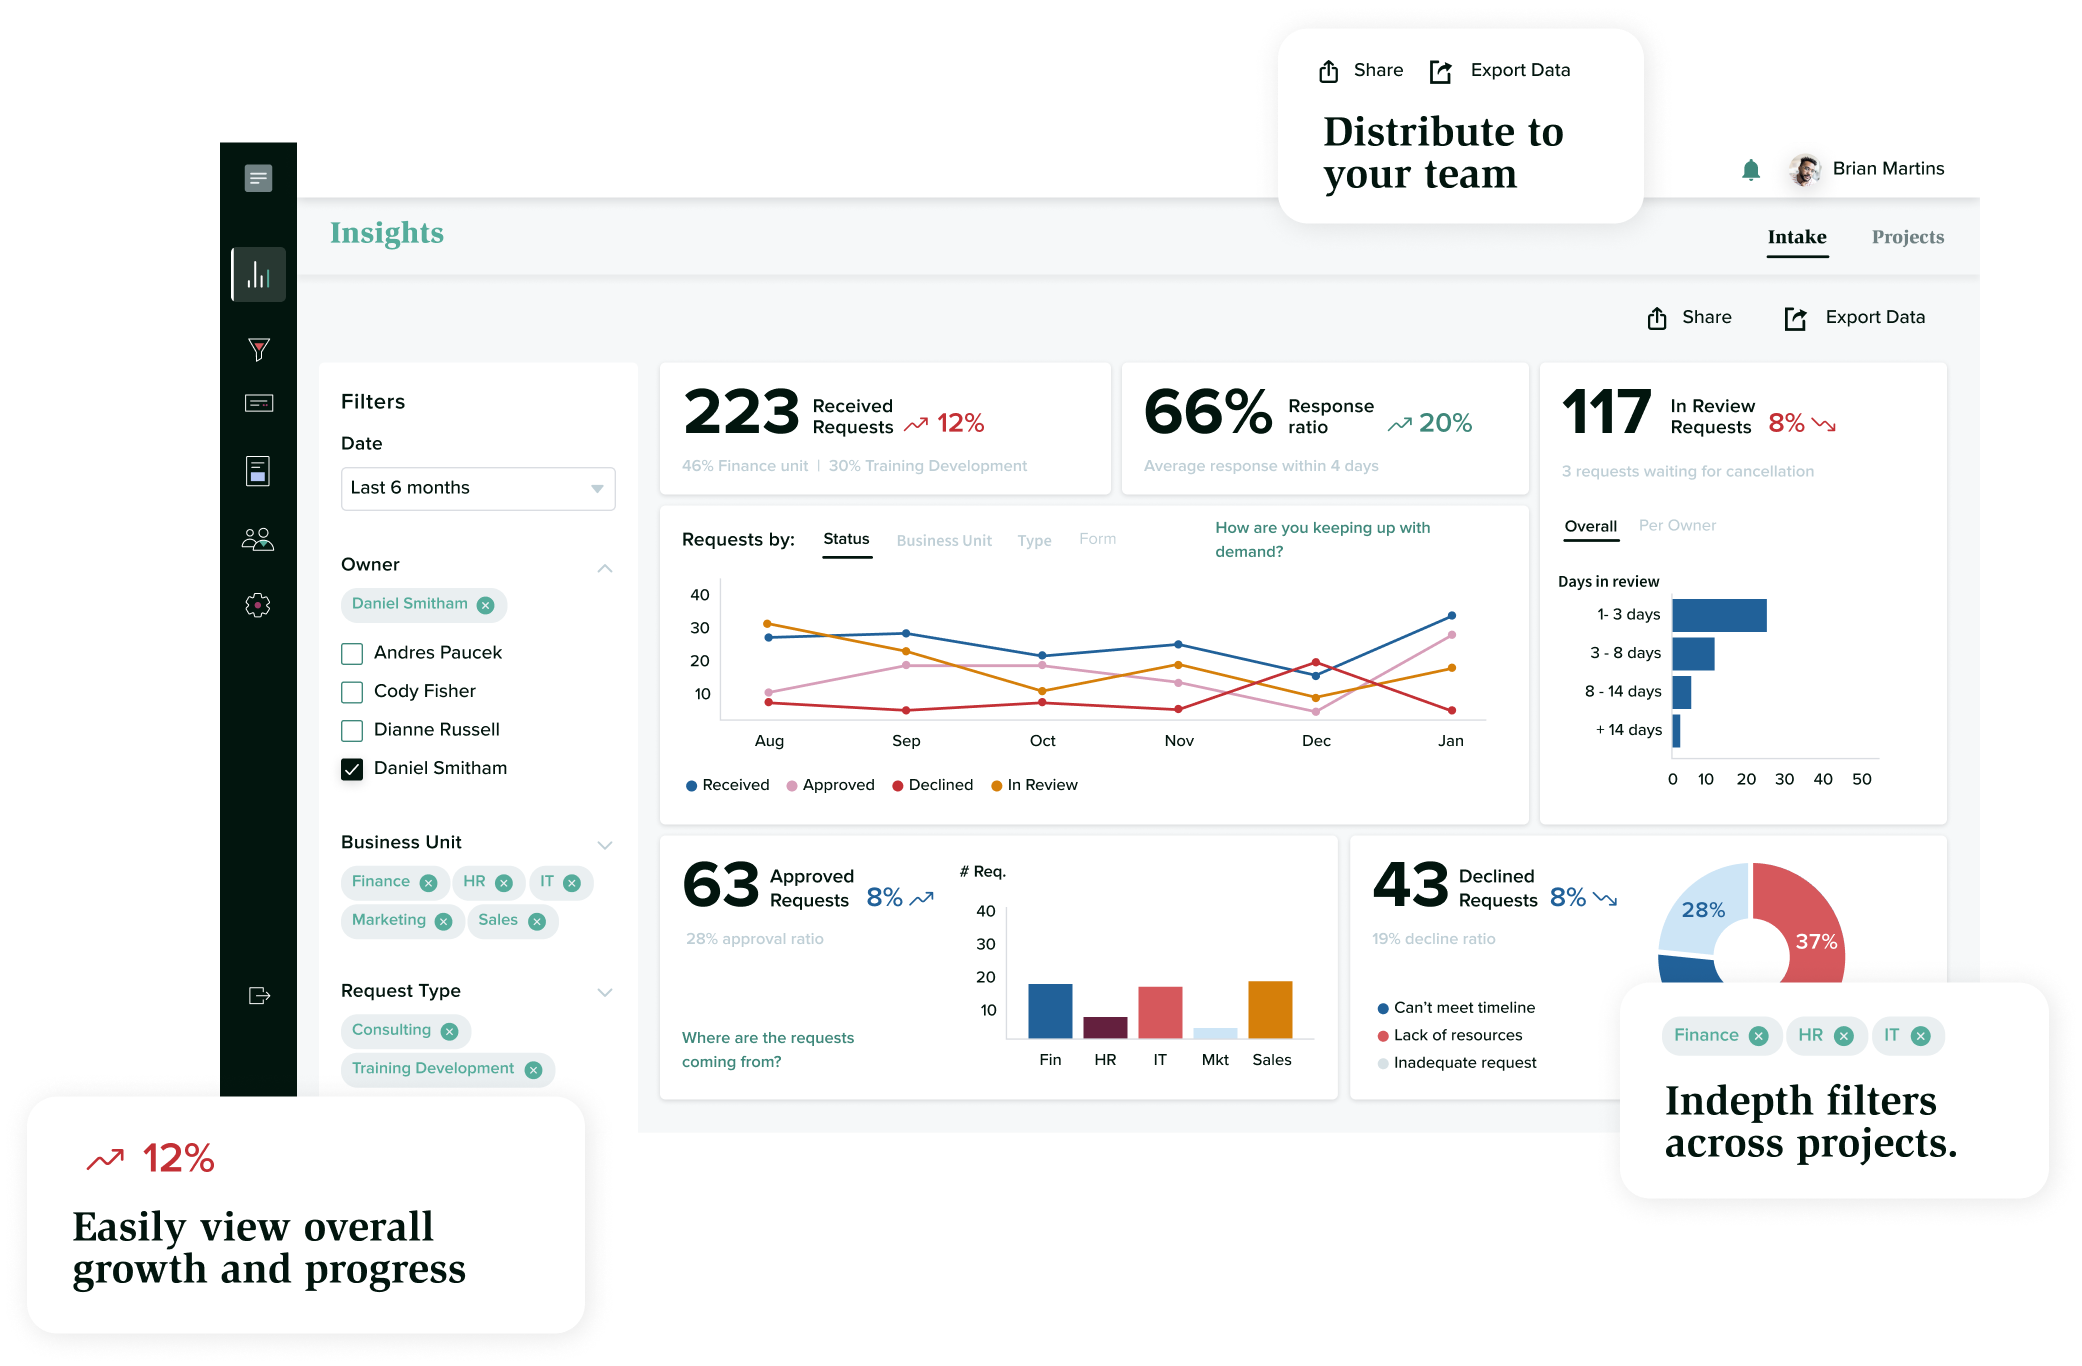
Make Effective, Data-Driven decisions
With Cognota
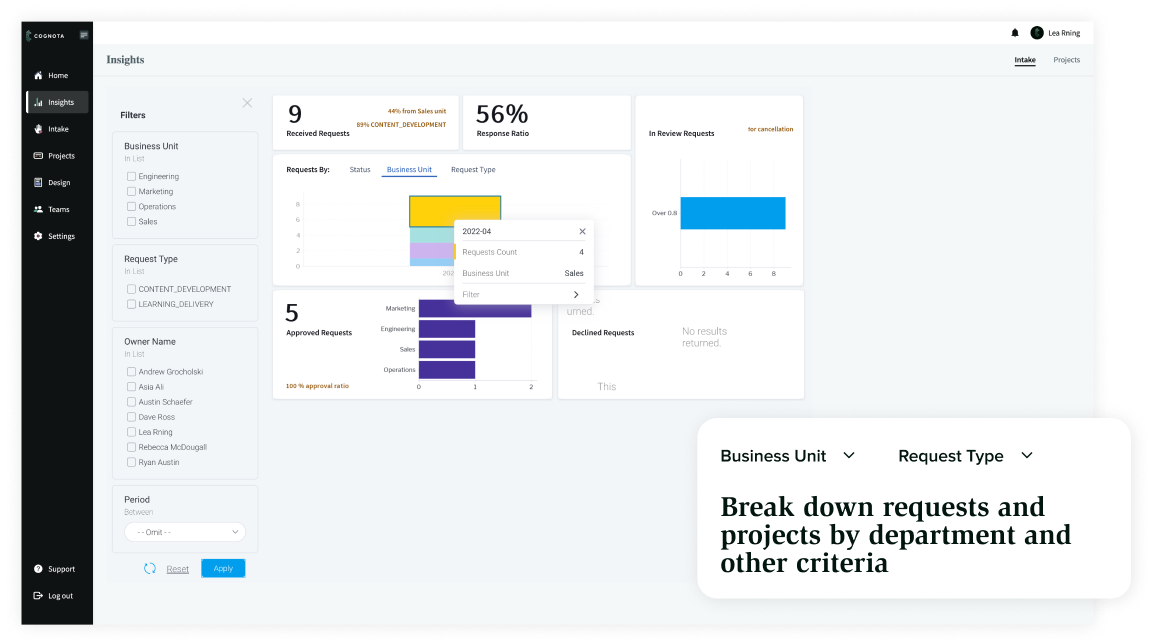
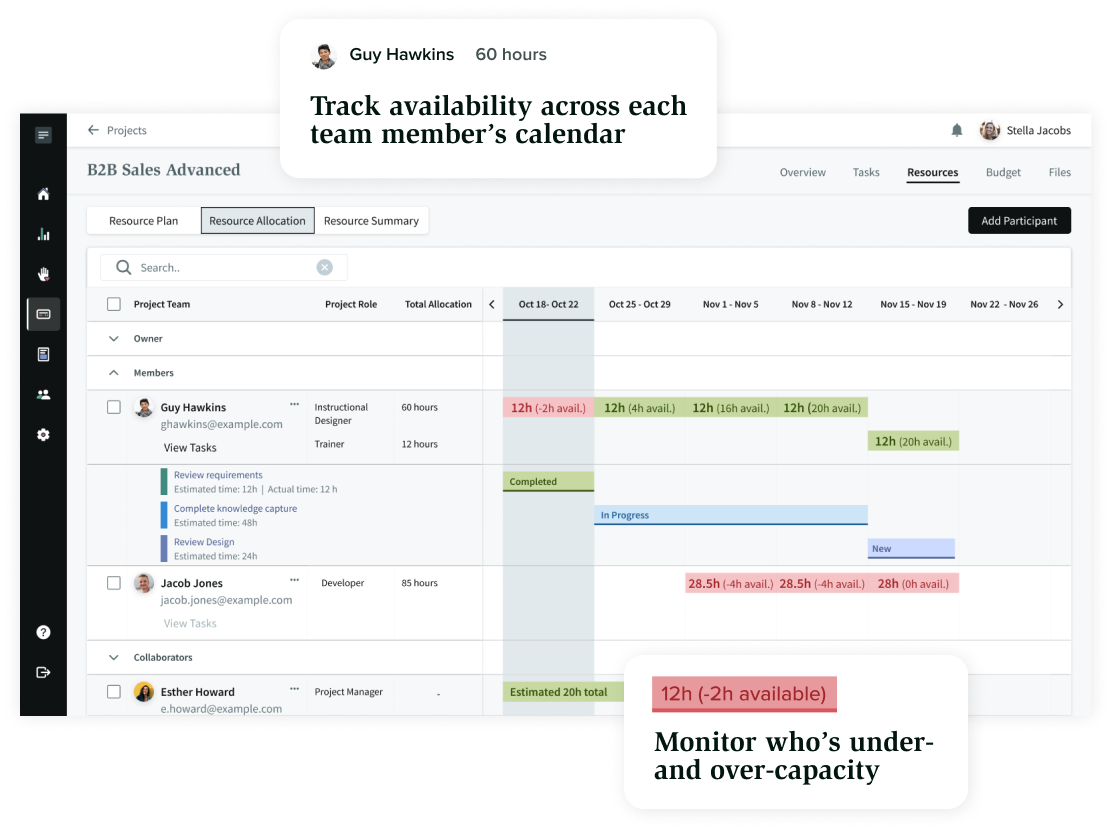
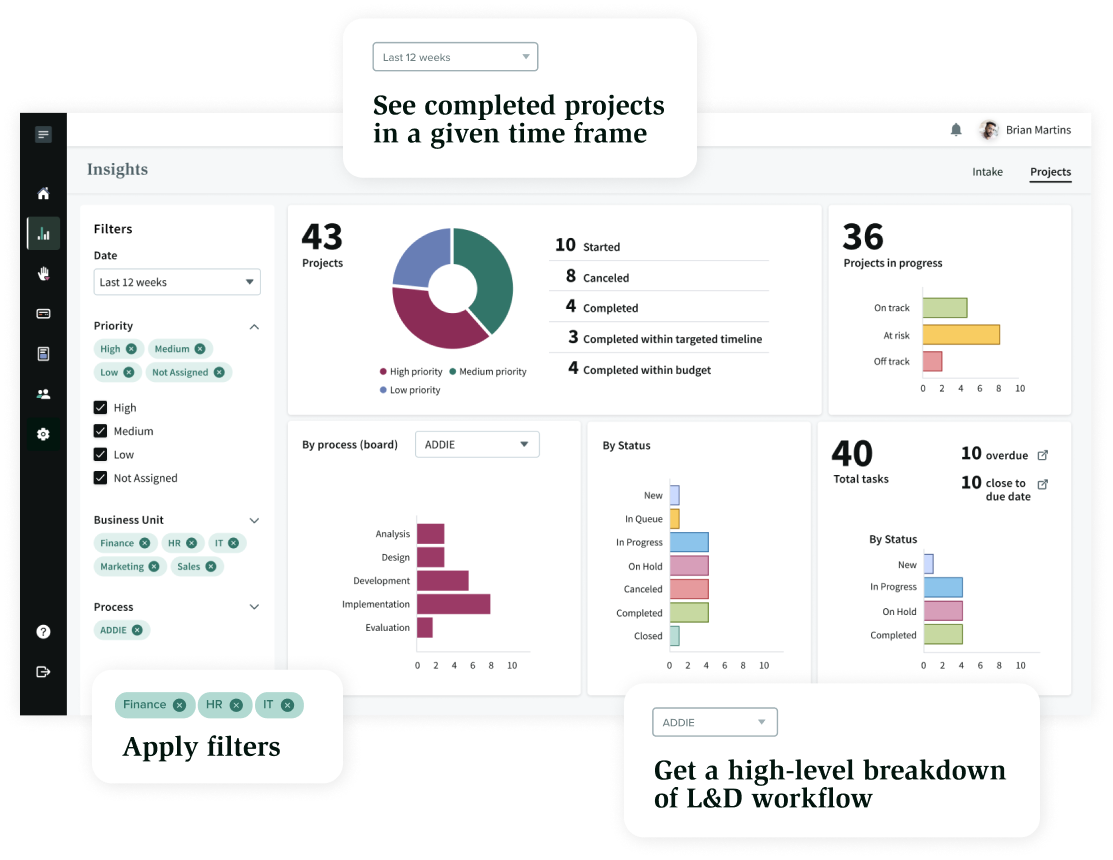
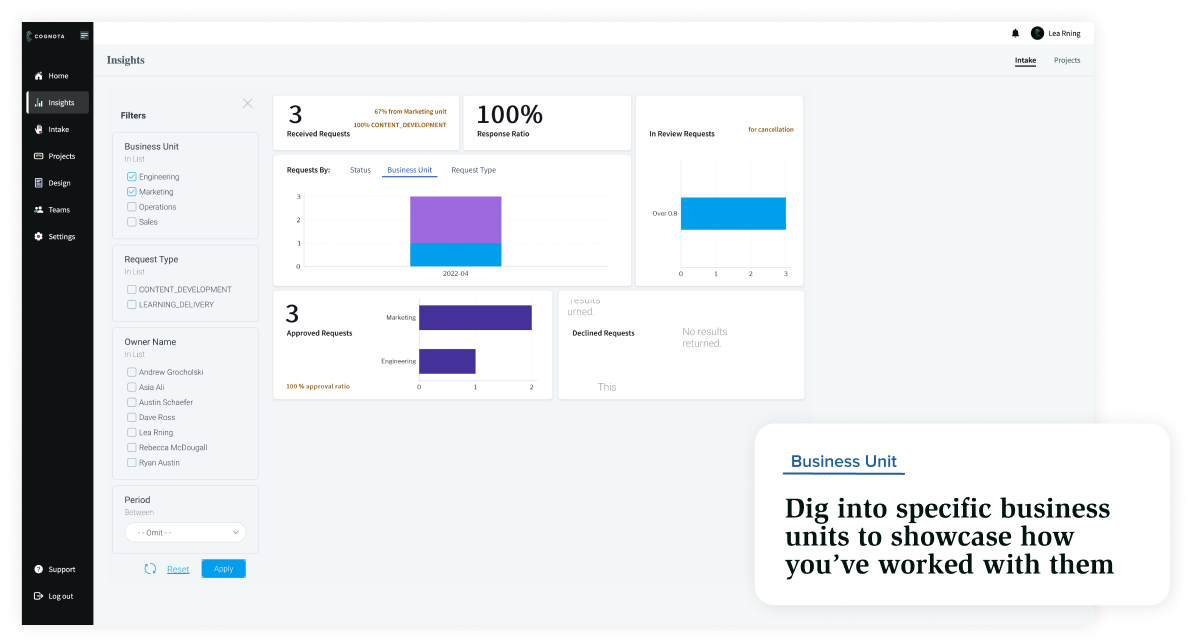
With Cognota Learning Team Data Is in One Place
and Easily Visualized on a Performance Dashboard
FAQs About Cognota’s Insights
Dashboard
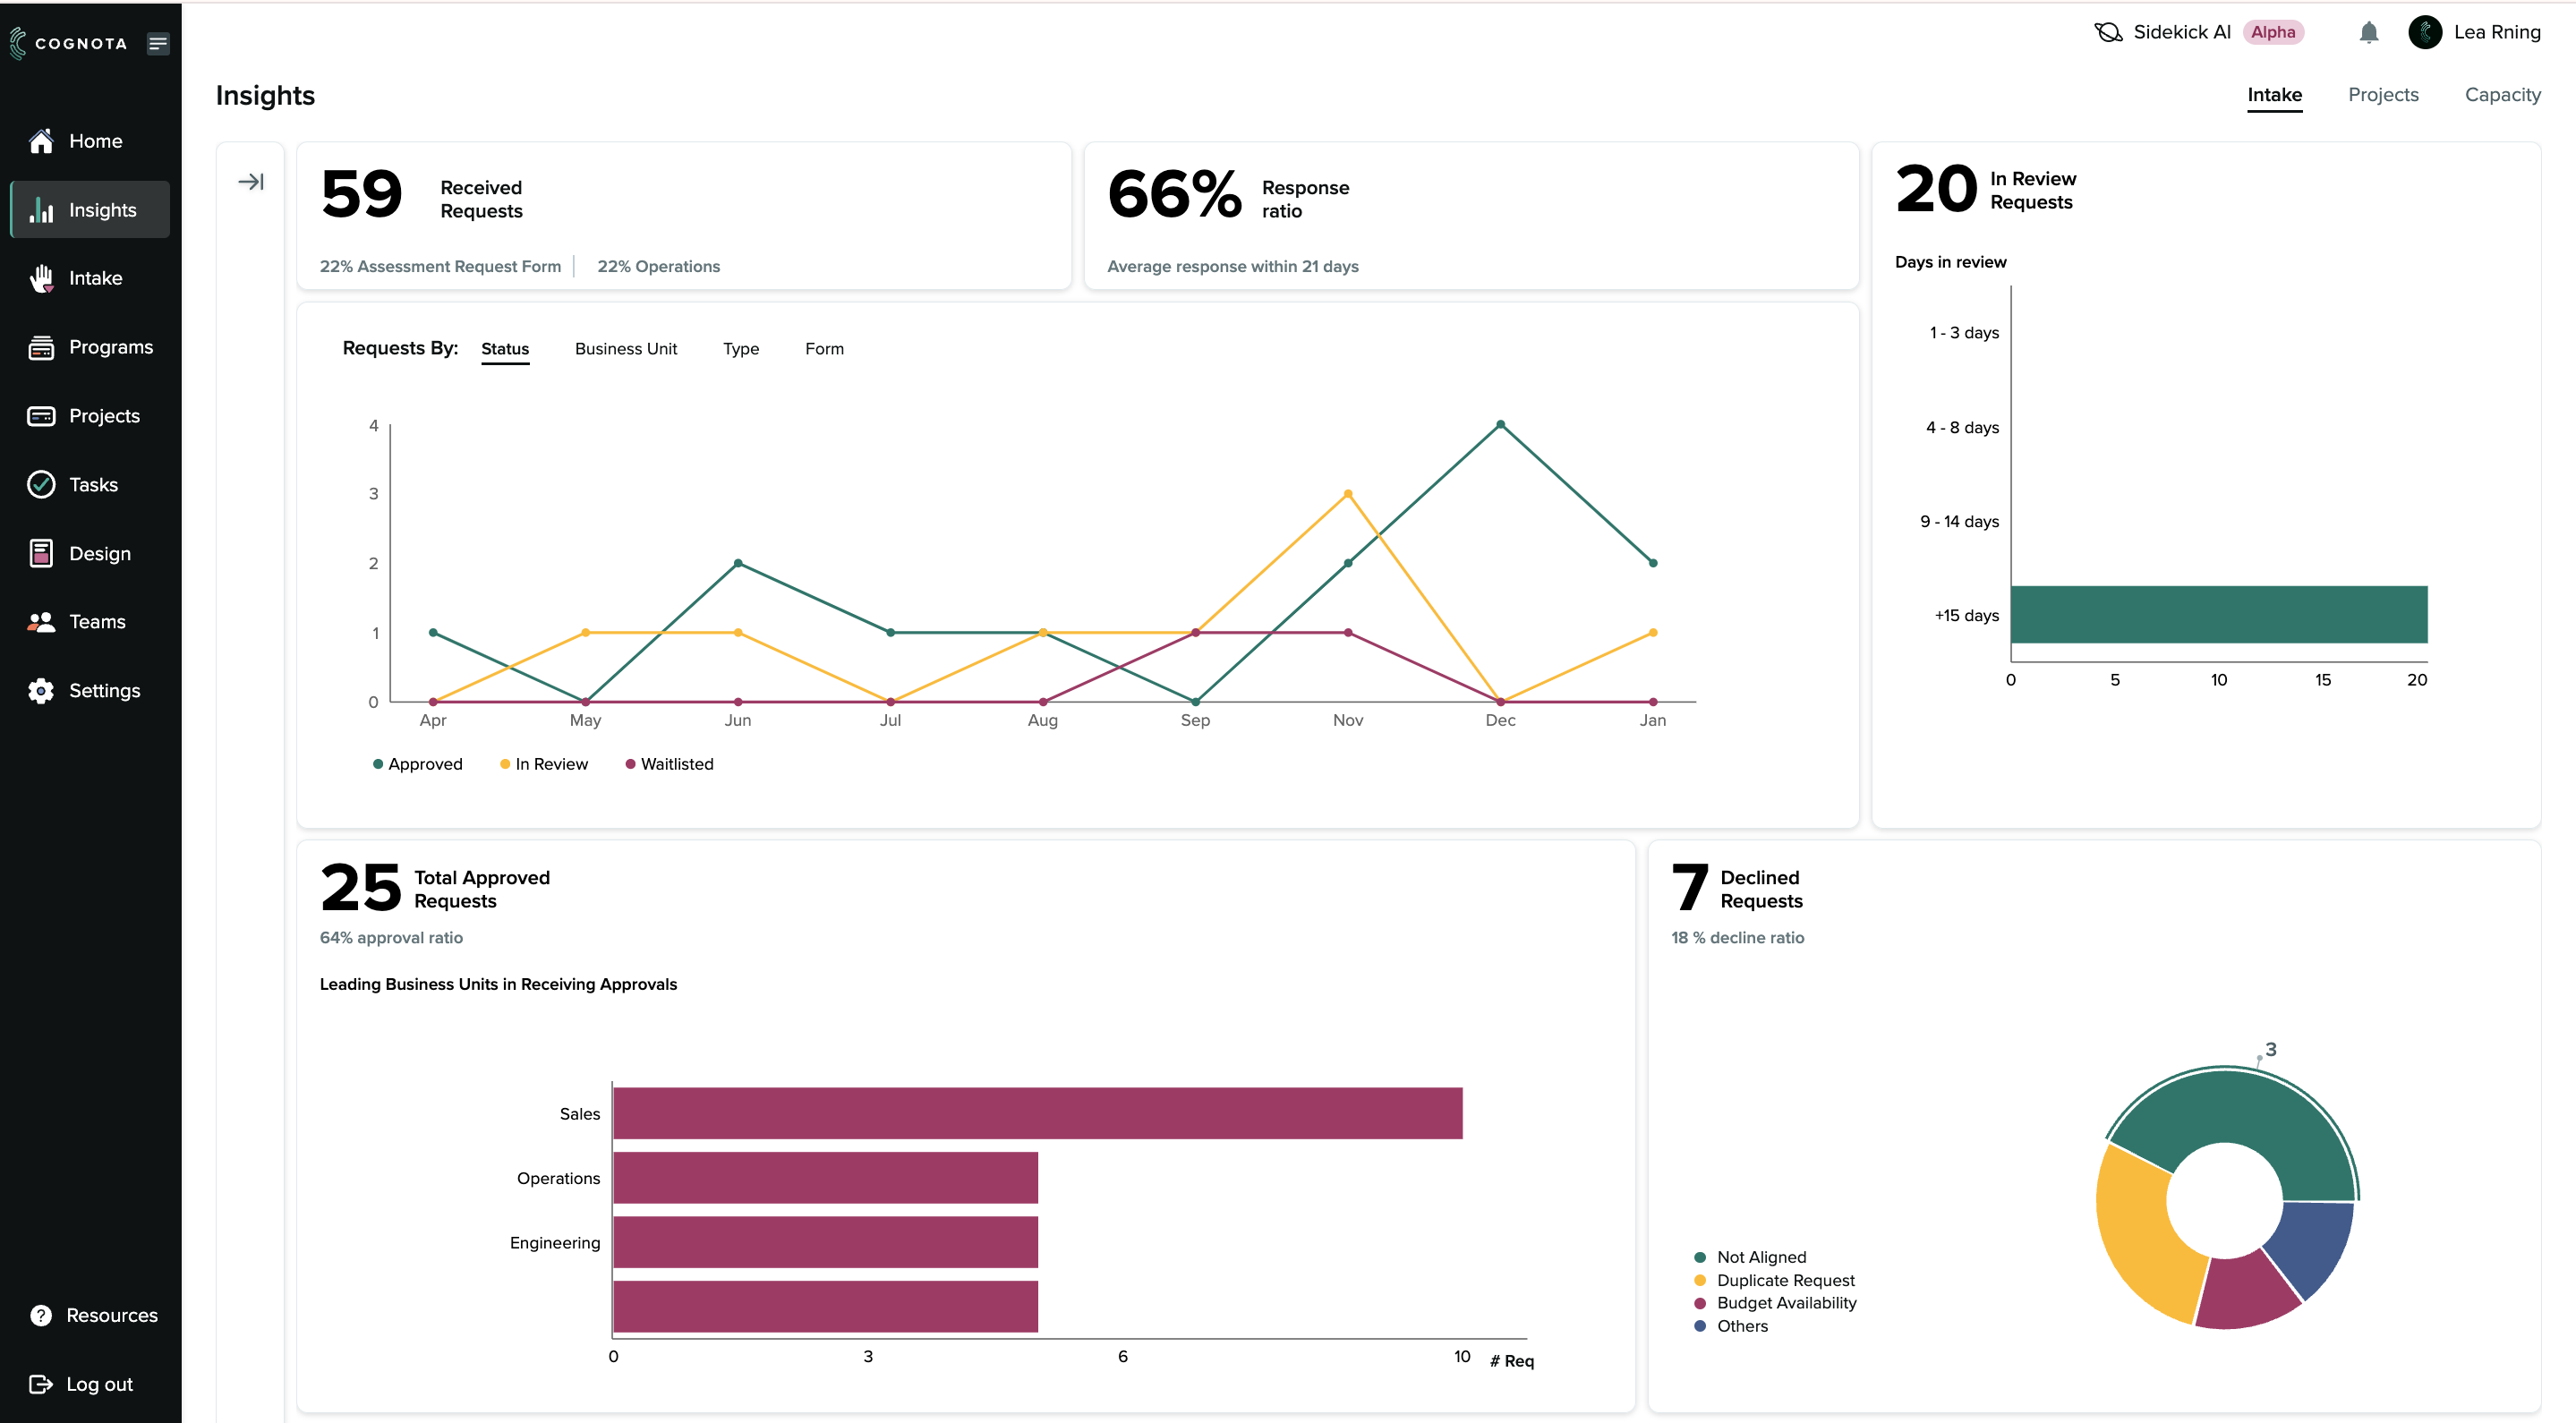
When you’re logged in, you’ll see a tab labelled Insights. Click that. From there, you can navigate between tabs to see different insights.
You’ll have the ability to integrate data from other sources. Just ask our team for more information.
No! The Insights dashboard is included as part of our annual subscription at no extra cost.
Access is granted to your Insights dashboard based on the user roles you configure in the system.
Yes! If those stakeholders have a role in the system that enables them to view dashboards, you can just send them a link. For those who don’t have access to Cognota, you can download a copy of the dashboard and share it.
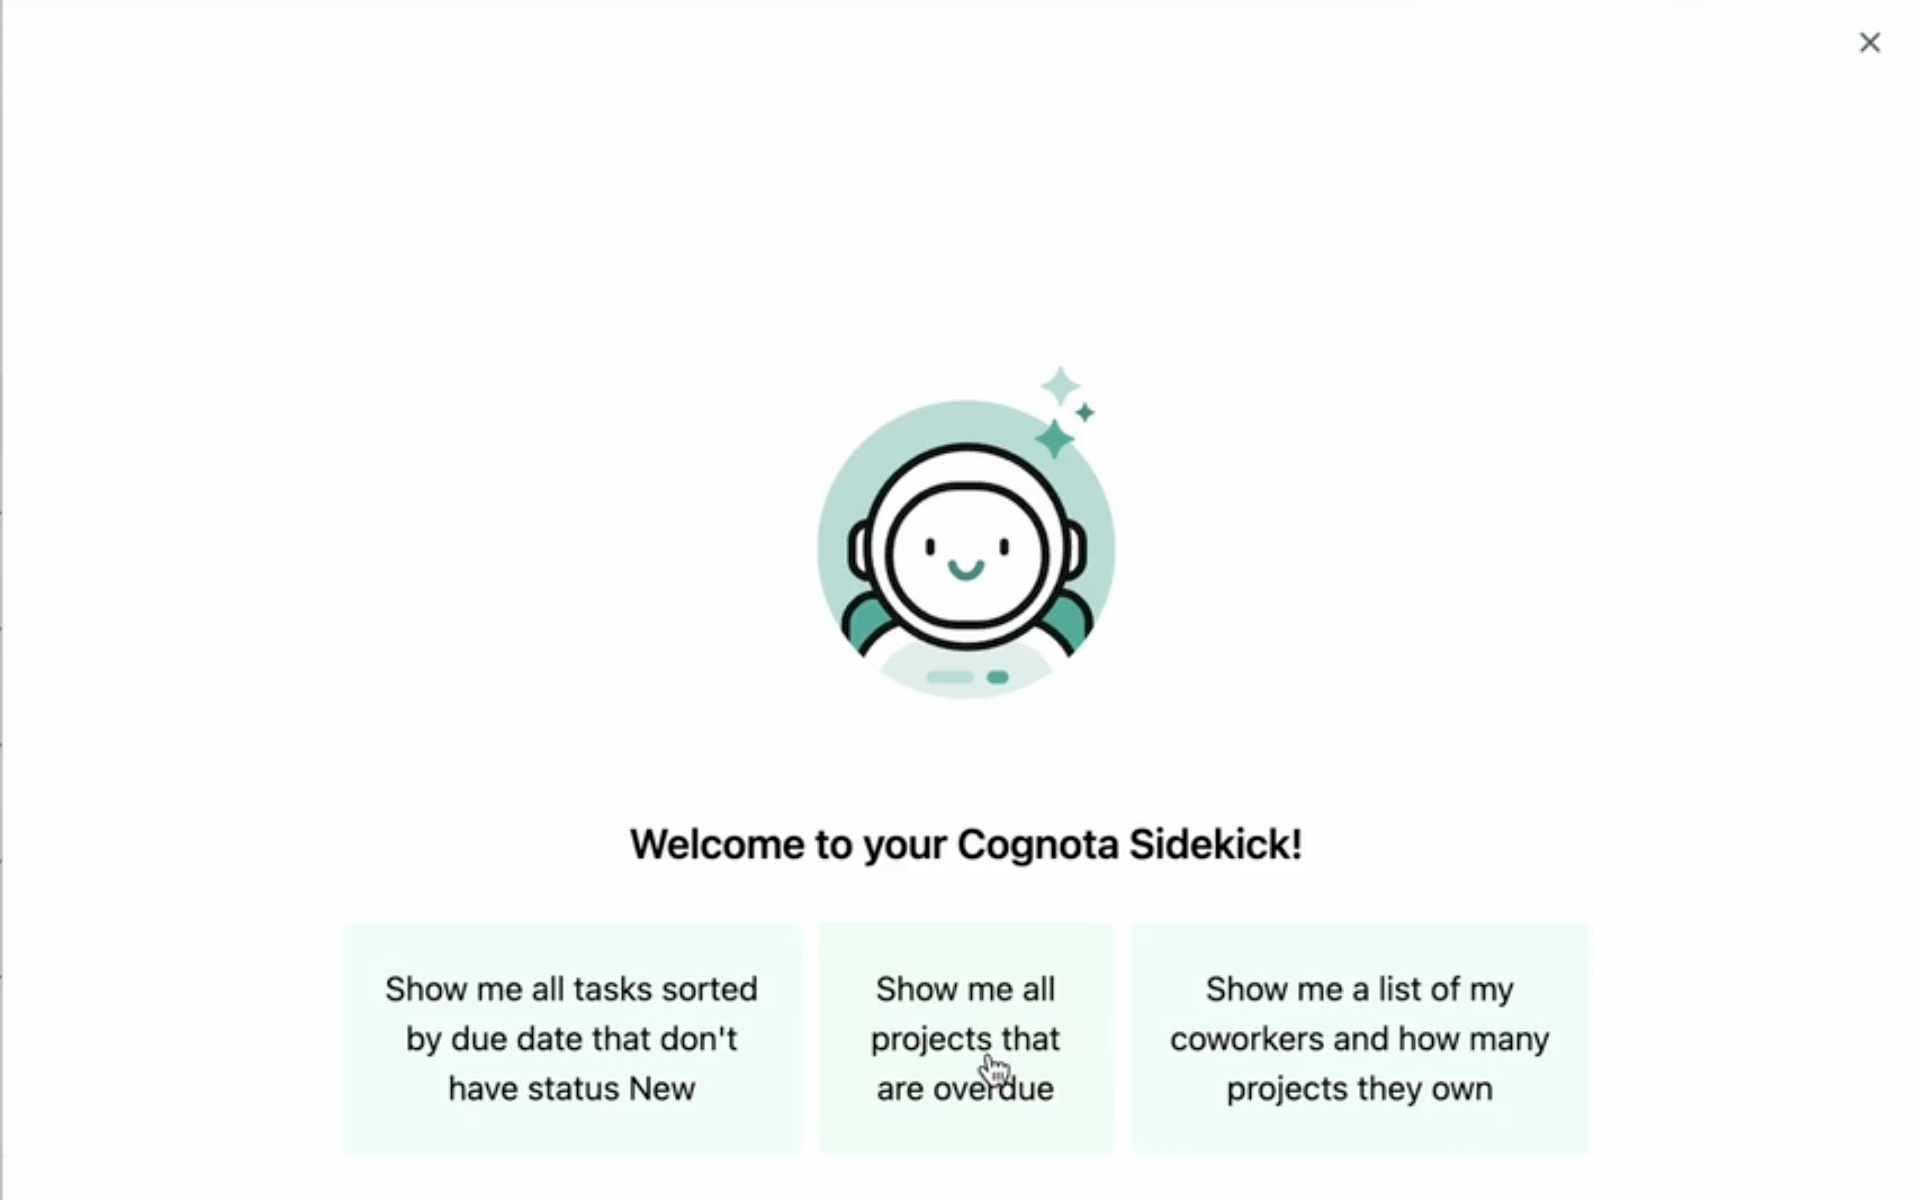
LearnOps AI (currently in Alpha) will offer instant access to critical data, generate actionable insights, and streamline LearnOps processes. This conversational AI tool aids in faster decision-making and maximizes L&D team productivity by providing real-time analytics and data-driven support.
| Cookie | Duration | Description |
|---|---|---|
| cookielawinfo-checbox-analytics | 11 months | This cookie is set by GDPR Cookie Consent plugin. The cookie is used to store the user consent for the cookies in the category "Analytics". |
| cookielawinfo-checbox-functional | 11 months | The cookie is set by GDPR cookie consent to record the user consent for the cookies in the category "Functional". |
| cookielawinfo-checbox-others | 11 months | This cookie is set by GDPR Cookie Consent plugin. The cookie is used to store the user consent for the cookies in the category "Other. |
| cookielawinfo-checkbox-necessary | 11 months | This cookie is set by GDPR Cookie Consent plugin. The cookies is used to store the user consent for the cookies in the category "Necessary". |
| cookielawinfo-checkbox-performance | 11 months | This cookie is set by GDPR Cookie Consent plugin. The cookie is used to store the user consent for the cookies in the category "Performance". |
| viewed_cookie_policy | 11 months | The cookie is set by the GDPR Cookie Consent plugin and is used to store whether or not user has consented to the use of cookies. It does not store any personal data. |