In L&D, strategic decisions are the roadmap to success. The introduction of Capacity Insights in Cognota unveils a transformative journey, not just through data points, but through strategic lenses that redefine how L&D teams operate. Let’s explore the impact of the functionalities in the Capacity Insights feature in driving effective decisions and charting a course for success.

Using the Time Frame Filter
The Time Frame Filter allows you to dissect capacity at specific time frames to gain insights into evolving patterns. Aligning data with custom timelines becomes a strategic tool for predicting future demands, ensuring proactive planning, and staying one step ahead in the dynamic landscape of L&D.
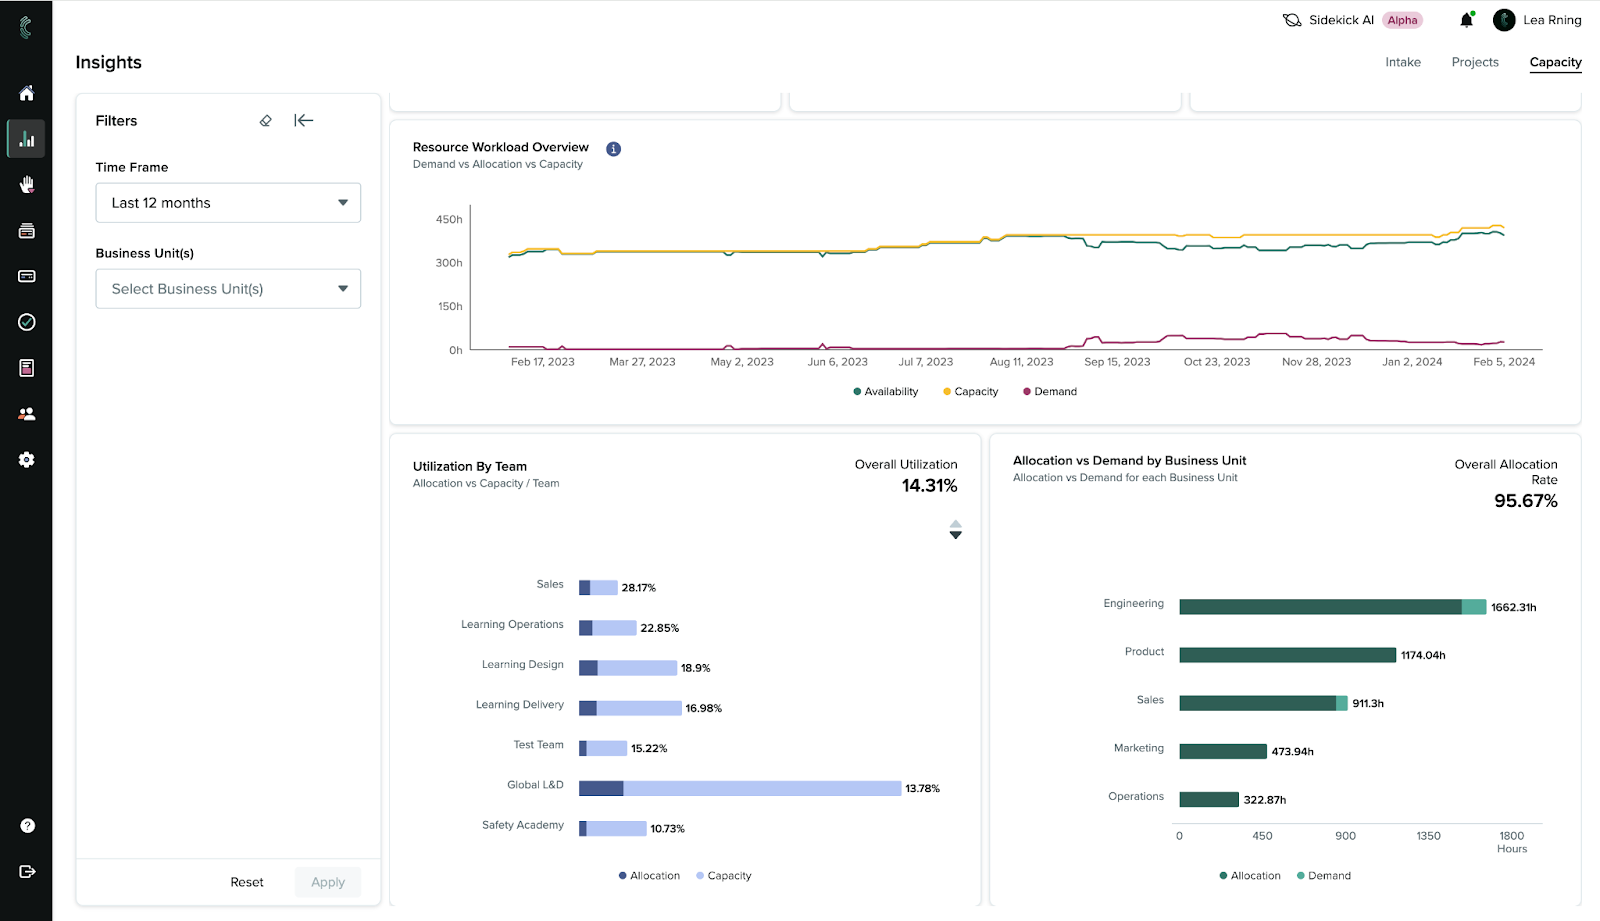
Resource Dynamics: Balancing Act and Efficiency Evaluation
Resource Workload and Utilization by Team charts serve as the heartbeat of your team’s efficiency. Instead of static numbers, view them as strategic indicators. Recognize opportunities for improvement, navigate workload bottlenecks, and transform your team into a well-oiled machine. These charts aren’t just about balance; they are blueprints for optimizing resource utilization, maximizing efficiency, and driving projects to fruition.
Strategic Resource Distribution: Aligning with Goals
The Demand vs Allocation by Business Unit chart unveils a map for strategic resource distribution. Identify high-demand areas, reallocate resources judiciously, and align your team with overarching organizational goals. This isn’t just about data; it’s about positioning your team where it matters most, ensuring resources contribute to the success of the entire organization.
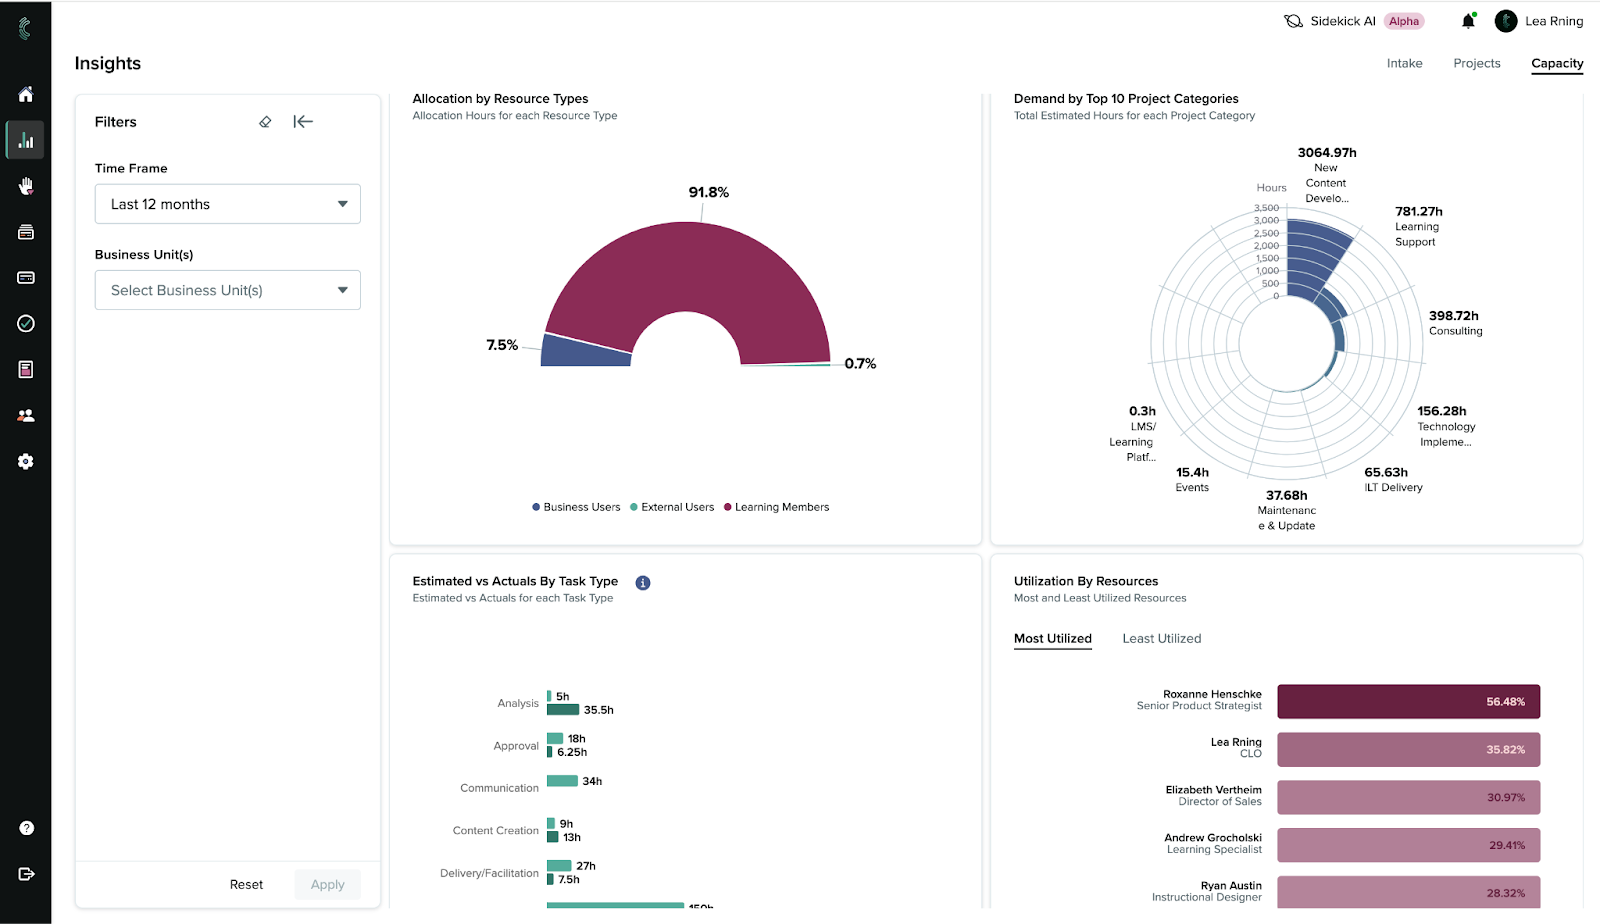
Fine-Tuning Workforce Composition: Allocation by Resource Type
Resource allocation becomes an art form with the Allocation by Resource Type chart. Understand the dance between internal teams and external vendors. Identify risks, align resource distribution with organizational objectives, and make informed, budget-conscious decisions. This chart is a compass for putting together a workforce that aligns with organizational goals.
Future-Proofing Strategies: Demand by Project Category
As we delve into Demand by Project Category, the focus shifts to the intricacies of project demands. Identify resource-heavy categories, assess skill requirements, and plan for future allocations. This isn’t just about meeting today’s challenges; it’s about ensuring your team is equipped for the evolving needs of tomorrow.
Benchmarking and Resource Optimization
The Estimated vs Actuals by Task Type chart serves as a guide for effective benchmarking. Learn from past estimates, refine future plans, and benchmark against your team’s own achievements. Meanwhile, the Utilization by Resources chart identifies your MVPs and underutilized talents, guiding strategic resource allocation for optimal team performance.
Transforming Insights into Action
As you absorb the insights from these charts, remember that data is not static; it’s a dynamic force guiding your decisions. Let these charts illuminate your path to informed decisions, optimized resource utilization, and a future where your L&D team thrives.
We’d love to hear how your team is utilizing the new Capacity Insights feature — share your comments with other users at learnops.com.