Our Customer Success Team shares some ways you can rethink and transform your L&D needs by strategically analyzing intake data using our revamped Insights feature.
As the saying goes: “Do not underestimate the power of data.” We couldn’t agree more. In a rapidly shifting work landscape, businesses are looking for ways to reshape and understand their business needs in order to ensure organizational alignment by positioning L&D as a valuable business asset.
A common theme of discussion with our customers is identifying ways they can utilize the intake data that Cognota captures to demonstrate meaningful business impact. Prior to the release of the new version of our platform, our customers relied on our Intake Insights snapshot that captured data focused on the total number and status of their Requests.
However, based on the feedback we received, and our commitment to empowering learning operations, we developed a more robust Insights feature that allows you to drill down into your Intake data. Today, we’ll be highlighting the updates as well as the relevance to transforming your L&D impact.

Before sharing what Insights in Cognota looks like, here’s a refresher of what the previous version captured:
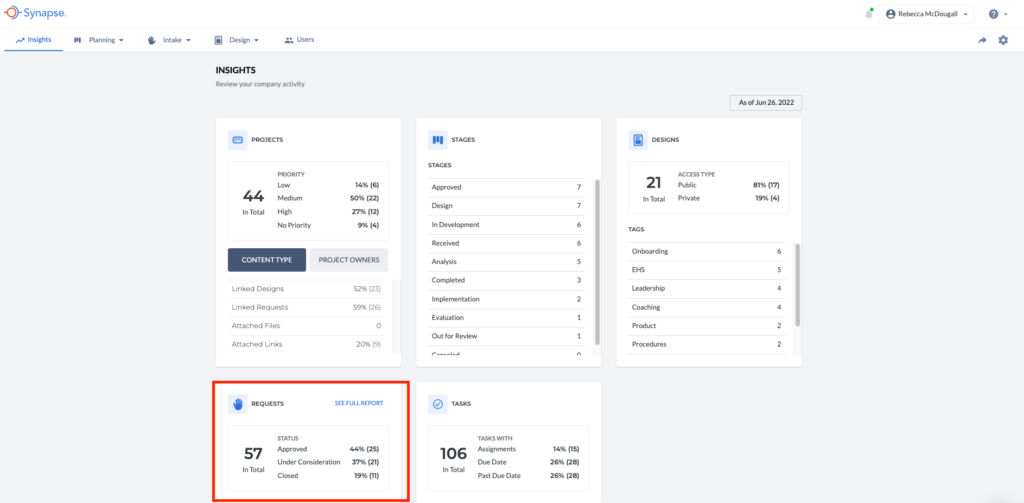
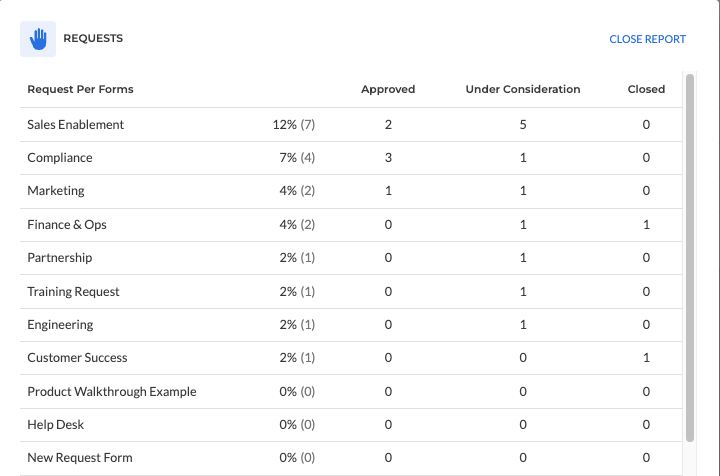
In the previous version, you could see a summary of your Requests with highlights of those that are Approved, Under Consideration, or Closed and their corresponding percentages. Further, you could even see a breakdown of your overall Requests by forms submitted as well as their status.
In Cognota, the Insights section has been revamped to include reporting that focuses holistically on your Intake data. Now, we’ve included charts to help you visually compare your data, and various filters to analyze your data further.
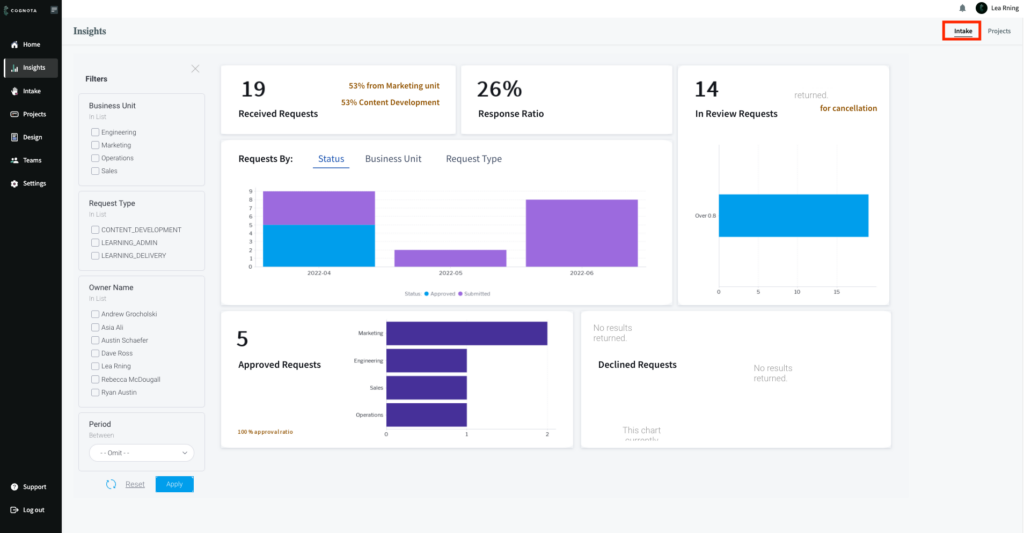
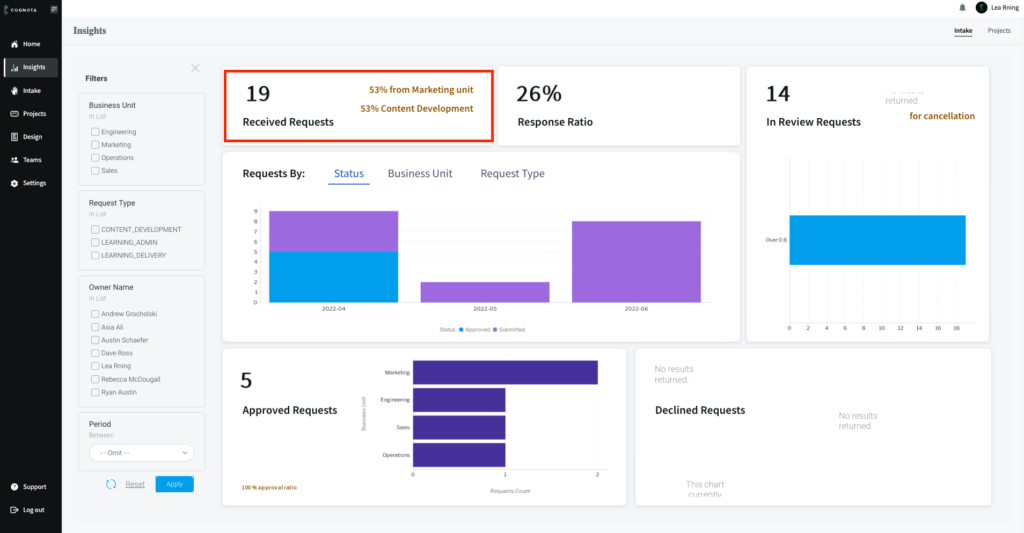
First, to the left of the Insights page, you’ll notice that we’ve added various filters that include Business Unit, Request Type, Owner Name and Period. You still get to see the total number of your requests just like the previous version, but you can now see the percentage breakdown of the Business Unit—departments that submit requests within your organization—where you get the most requests from as well as the percentage of request type that’s taking the chunk of your received requests.
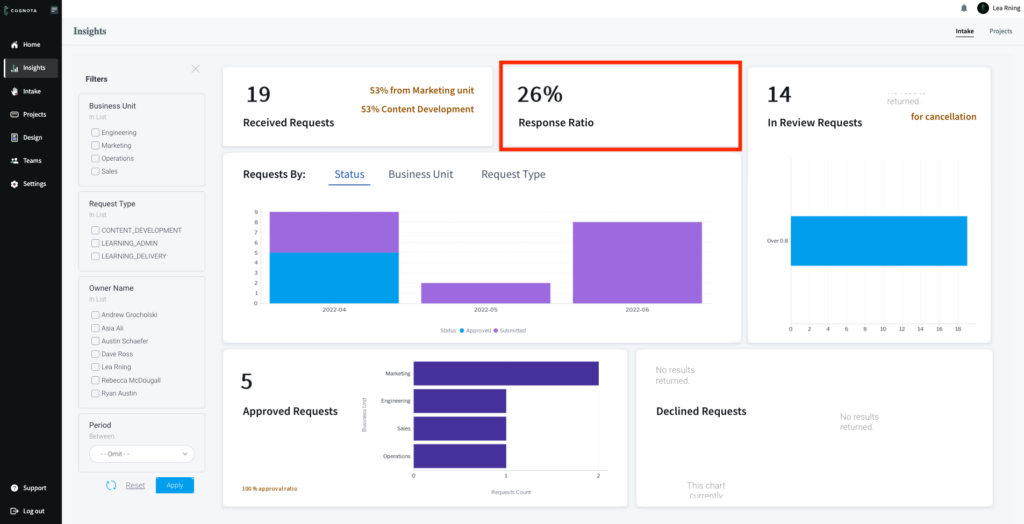
We’ve also introduced a section called Response Ratio. Response Ratio is the ratio between your approved requests and the requests in review—it shows the amount of requests that have received a response.
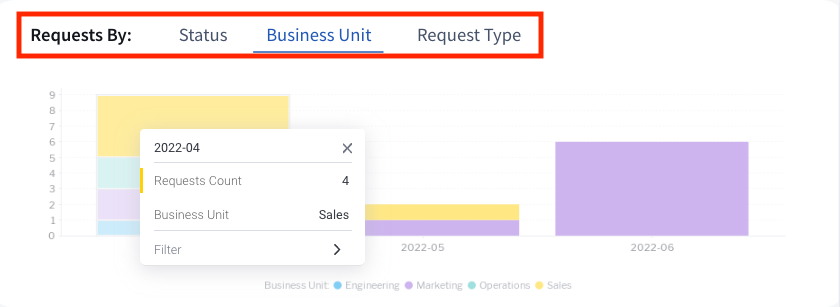
Also, you have the ability to see a breakdown of your Intake by the following categories:
- Business Unit
- Status
- Request Type
When you hover over the chart in any of these categories, you get a pop up view that can allow you to either include or exclude the information.
Other reporting variables you can view are the number of Requests in Review, Approved Requests and Declined Requests. You also have the ability to hover over any of the charts for more information.
Now that we’ve shared all that information about what’s being reported in our new Insights section, here are a couple of ways the data can help you transform your L&D needs.
- L&D Budget Allocation: Visibility into the type of requests that are being submitted as well as the departments submitting those requests can help you approach your L&D budget allocation from a different perspective. At a high level, you can start to identify trends across your business units, who’s submitting the most requests, whether or not there are outliers, if there is an under allocation or over allocation issue based on further investigation of your data, and determine the next course of action to ensure alignment.
- Resources and Planning: Another great way you can benefit from the Insights section is getting a holistic view of your Requests and understanding how they are progressing down the pipeline. For example, what volume of requests are you receiving? Are the majority of your requests in review? Is your Response Ratio at par with the standards you expect to see? Digging into your data further can help you determine whether or not you have the resources to get requests moving forward, and how to plan accordingly to get things into the next phase.
- Prioritization: Now, you can get granular details on which of your request types are being prioritized the most and determine whether they are high yielding or low yielding in order to make informed decisions.
- C-Suite Engagement: With our effective metrics and measurements, you can prove business value to your C-suite stakeholders by showcasing the various Business Units within your organization that you’ve collaborated with in terms of your Intake and how that trickles into the broader organization goals. This is a valuable way to prove a case for ROI by sharing your Intake Insights as a key data point that yields tangible benefits of an engaged organization culture.
It is worth noting that the Insights section is a heavy focus for development on our Q3 product roadmap and there are more functionalities to be expected in the coming months. We’d love to get your feedback on this feature so please feel free to reach out to us at support@cognota.com.