When data is scattered across spreadsheets, project management tools, and learning platforms, Talent and L&D teams end up spending a lot of time chasing numbers. And after all that digging through disconnected systems, the data often doesn’t reveal much.
The L&D team at Sun Life, a global financial firm, knew this pain all too well.
As Krista, Learning Strategic Initiatives, Sun Life said “We had over 10 different tools for intake, scheduling, and reporting. Nothing talked to each other. Reporting was in silos. And we had no visibility into what was being worked on.”
After implementing Cognota, they centralized their reporting and gained real-time visibility into requests, project status, and capacity.
A learning platform with built-in metrics dashboards consolidates scattered data, tracks real-time performance, and helps you optimize your L&D strategy. You can turn raw data into measurable outcomes and see which training initiatives actually deliver value.
In this article, we’ll discuss how to build a learning and development metrics dashboard, which data and metrics are important, and how it can help you make each training program successful.
What is a Learning and Development Metrics Dashboard?
A learning and development dashboard centralizes data from your training initiatives and uses it to improve future learning programs. This helps L&D teams see what’s working, what’s not, and where training is making a difference.
Instead of relying on assumptions, you base your decisions on facts.
Each course, workshop, or onboarding program produces valuable data. When you analyze this data, you can see how employees learn and apply new skills, which teams aren’t getting enough training, which programs improve on-the-job results, and how costs compare to program effectiveness.
These findings help you make confident, data-driven decisions and communicate clear results to stakeholders.
How Learning and Development Metrics Dashboards Can Optimize Performance and ROI
85% of business leaders think the need for skills development will increase due to AI and digital trends.
“L&D must become more agile to respond to changes faster and deliver learning more rapidly and more cost effectively,” says Chantal Steen, Senior Director at Gartner.
L&D teams need a metrics dashboard to improve performance, shorten delivery cycles, prove ROI (return on investment), and clearly report outcomes to stakeholders.
Here’s why building a specific L&D metrics dashboard is important:
Make Data-Backed Decisions
A dashboard turns scattered L&D data into a clear snapshot, so you can quickly track which programs are performing well, which ones are underperforming, and where to focus next.
Improve Learner Experience
Dashboards show where employees struggle, what content is underperforming, and which formats get better results. This helps you refine timing, delivery, and content design based on real behaviour and feedback.
Prioritize the Right Programs And Requests
You can compare training requests using real data like audience size, urgency, compliance risk, and expected business value. This helps your team prioritize programs that align with strategic goals, deliver strong ROI, and drive measurable business outcomes.
You can use this ready-made employee needs analysis template to identify the right training programs.
Reduce Manual Reporting Tasks
Instead of rebuilding reports from scratch each time, a dashboard combines data from different sources into totals and trends in a standardized format. This allows your teams to focus on analyzing and improving training programs.
Plan Data-driven Capacity And Delivery Timelines
Dashboards give you visibility into workload, cycle time, and throughput. You can use this data to plan eLearning projects, forecast delivery, flag bottlenecks early, and set realistic expectations with stakeholders about what can be delivered and when.
How to Build an Insightful L&D Metrics Dashboard
If your data is easily accessible, your teams can plan, prioritize, track, execute, and analyze programs for business impact more effectively.
Here’s how you can build an effective L&D dashboard:
1. Choose Your Dashboard Goal And Audience
Define who the dashboard is for and what decisions it should support.
For example, executives and business leaders care about business results. This includes how learning improves performance, engagement, or team effectiveness, and how investments align with business goals.
L&D heads and managers want to analyze performance and planning. They care about what programs are effective, what to improve, and how to justify the budget.
2. Identify Your Data Sources
Data sources are mainly divided into three categories:
- Primary source: Data you collect directly from your learning efforts, such as LMS data, attendance records, survey responses, and feedback forms. This shows you learning activity and engagement clearly.
- Secondary source: Data created by internal teams that helps you connect training to real performance. This includes HRIS data, performance reviews, manager evaluations, productivity metrics, or onboarding milestones. You can use this data to link training to job performance and business outcomes.
- Third-party source: Data from external tools or vendors you use for learning or performance tracking, such as eLearning authoring tools, content libraries, external survey tools, and analytics platforms. It can fill gaps your core systems don’t track and gives you richer insights.
3. Define KPI Framework
A KPI (key performance indicator) framework helps you choose metrics to measure business impact.
Start by defining the business outcome you want to influence, such as faster onboarding, fewer quality errors, higher productivity, or reduced risk. Next, list the questions your dashboard must answer, like whether skills improved, behavior changed on the job, or the program was delivered efficiently.
Then select KPIs that track progress across business results, learning effectiveness, and operational efficiency, so your dashboard shows impact.
4. Include Standard L&D Metrics on Your Dashboard
Make sure you add a core set of metrics that most L&D teams already track, so your dashboard is easy to maintain and useful for stakeholders.
Some of the common L&D metrics include:
- Training attendance rate
- Assessment scores and pass rate
- Learner satisfaction score
- Average time to complete training
- Course completion rate (completed vs enrolled)
- Drop-off rate
- Training coverage (% of target audience trained)
The right metrics depend on your priorities and business and ROI goals.
5. Set Up Data Governance for Accuracy
Data governance is important to get reliable metrics. This makes sure reports don’t change depending on who pulled the numbers or which spreadsheet version you used.
To keep your L&D dashboard accurate:
- Standardize intake fields so every request captures the same key details, such as owner, business unit, audience, priority, and due date.
- Define owners for each metric to keep definitions consistent and improve accountability.
- Use consistent naming conventions for programs, departments, and request types to avoid duplicates in reporting.
- Set a weekly or monthly update cadence so everyone sees the updated dashboard.
- Archive outdated metrics so the dashboard stays actionable.
But doing this manually is time-consuming and prone to errors.
Cognota helps L&D teams at enterprises align intake to business goals. You can set clear learning objectives and follow a defined operating model. Everyone follows the same rules for who submits requests, who approves them, who owns delivery, and how requests move through each step.
This consistency keeps the underlying data clean. When every request has the same fields and statuses, your dashboard can report reliable metrics.
How Sun Life Replaced 10+ Tools With Cognota’s L&D Dashboard
Sun Life’s global L&D team struggled with scattered data across 10+ disconnected tools. Here’s how they used Cognota’s L&D metrics dashboard to centralize operations, improve visibility, and report ROI with confidence.
The Problem: Low Visibility And Siloed Reporting
Sun Life’s global L&D team supported thousands of employees across multiple countries and teams, including facilitators, strategic consultants, quality analysts, and knowledge managers.
But their operations were spread across 10+ disconnected tools for intake, scheduling, and reporting. The team couldn’t plan effectively. Manual work increased operational costs. And ROI was hard to track.
“Even after 10 years, we were still struggling with the same challenges,” said Krista, Learning Strategic Initiatives at Sun Life.
The Solution: Centralized LearnOps With A Single Source Of Truth
To address this, Sun Life implemented Cognota to centralize how L&D work is tracked and reported. Our L&D metrics dashboard helped the team:
- Structure implementation across global teams: Onboard key workflows and users, then expand to more teams and stakeholders through live demos and Q&As.
- Gain end-to-end visibility: Create a single source of truth for requests, project status, and team workload.
- Reduce manual reporting effort: Standardize workflows across learning, quality, and knowledge teams for automated reporting.
- Improve resource planning: Get a real-time view into who is doing what and when to support capacity planning and prioritization.
Results: Better Reporting and Smarter Planning
With Cognota built-in L&D dashboards, the team could report operational performance with confidence.
- Reduced tool sprawl: Helped lower costs by replacing 10+ tools with one platform.
- Increased productivity: Freed time previously spent on manual intake, tracking, and communication.
- Faster data-driven decision-making: Provided real-time visibility into workload and capacity planning to improve decisions and forecast budget.
- Maximize ROI (return on investment): Used dashboard insights to prioritize high-impact initiatives and show business leaders clear business impact and ROI.
“Cognota makes our team more efficient, strategic, and aligned. It’s not just a tool—it’s the foundation for how we deliver value,” said Krista.
You can read the full case study here.
How Cognota Simplifies L&D Dashboard Building and Reporting
L&D teams at large companies often use Excel templates to build a learning and development metrics dashboard. On top of taking too much time, they are difficult to manage and go out of date quickly.
Cognota is a learning operations platform that helps L&D teams manage their work from request to delivery. It brings intake, project tracking, and reporting into one system, so teams can plan capacity, prioritize work, and measure results in real time.
Cognota’s built-in dashboards capture and visualize operational L&D data. This helps teams track program effectiveness, report business impact, and align learning investments with organizational goals.
Here’s how Cognota helps you build and manage L&D dashboards to maximize efficiency and business impact:
Unify Data from Intakes and Project Workflows
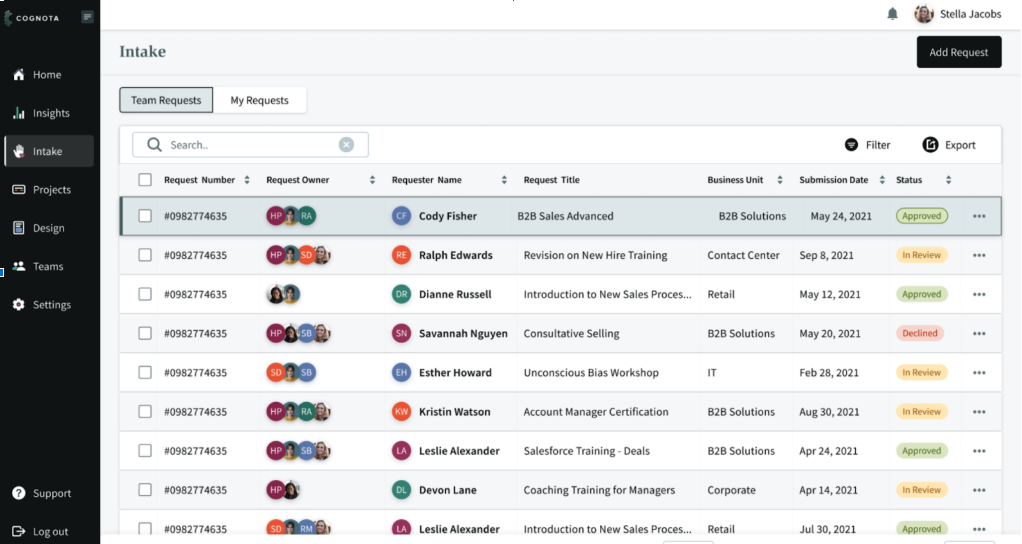
Cognota captures every learning request from across the business in a structured Intake with standard fields, approval decisions, timestamps, and reasons for decline. It also links the intake request to the project, so the same record carries the key details, from initial request to training program delivery.
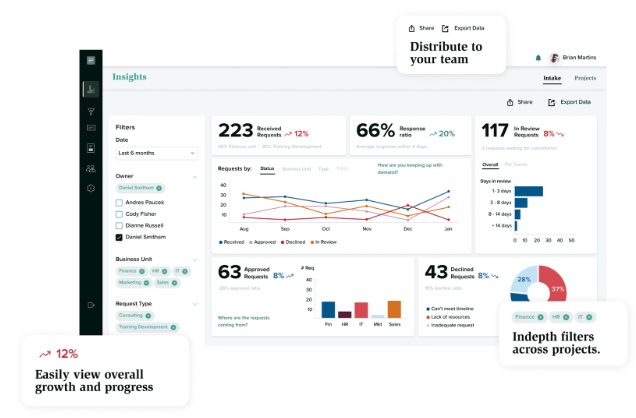
Cognota turns data collected from the projects into report metrics such as demand volume, approval aging, delivery progress, delays, and delivery speed.
Create Custom L&D Dashboards and Reports
Cognota lets you build custom dashboards with filterable reports. You can track metrics by business unit, request type, program, owner, status, priority, or timeframe.
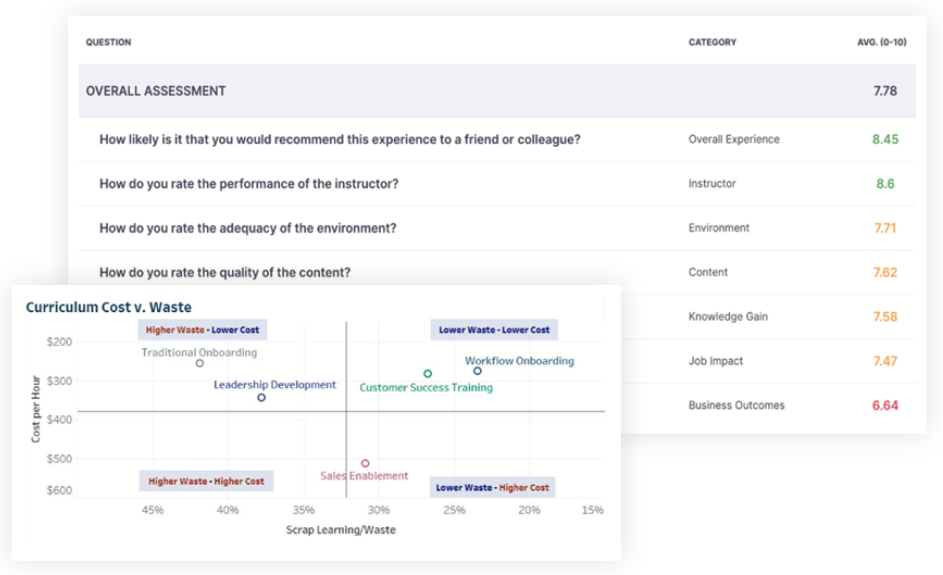
For evaluation reporting, it also includes clear report views, including:
- KPI Scorecard: Choose the KPIs leaders care about based on your L&D data
- Compare tool: Compare results across groups like programs or audiences
- Answer Summary: Shows survey results, crosstabs, and learner comments in one place.
Governance Tools for Data Accuracy
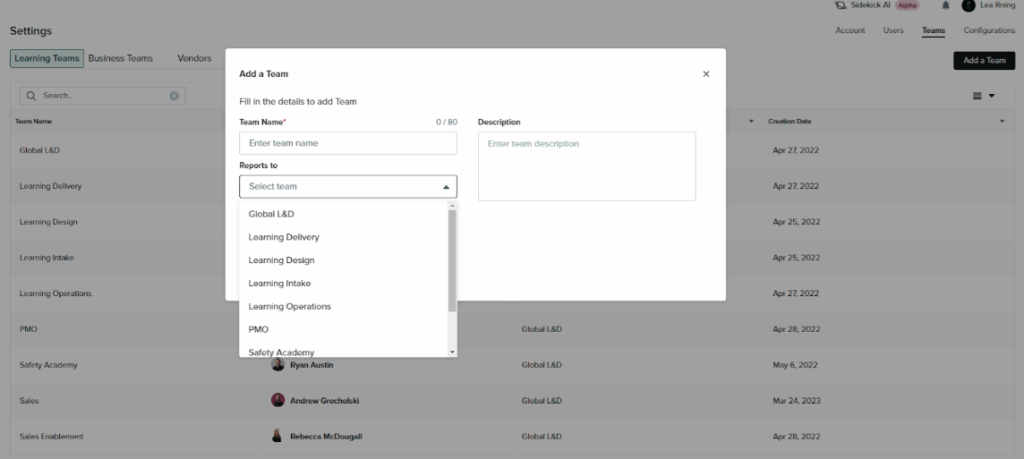
Cognota supports dashboard governance by standardizing how L&D data is captured at the source. Admins can set up custom intake forms, required fields, and default role-based access.
This makes your dashboards more reliable and up-to-date since reporting is based on structured workflow data, not manual spreadsheet clean-up.
AI for Predictive Insights
Cognota offers AI-powered predictive insights for your learning operations. You can generate weekly or monthly reports, and the platform summarizes key trends using your existing data.
This helps you identify cost-saving opportunities in training spend, plan learning programs, allocate optimal budgets, and make strategic decisions for healthy ROI.
Measure ROI Potential
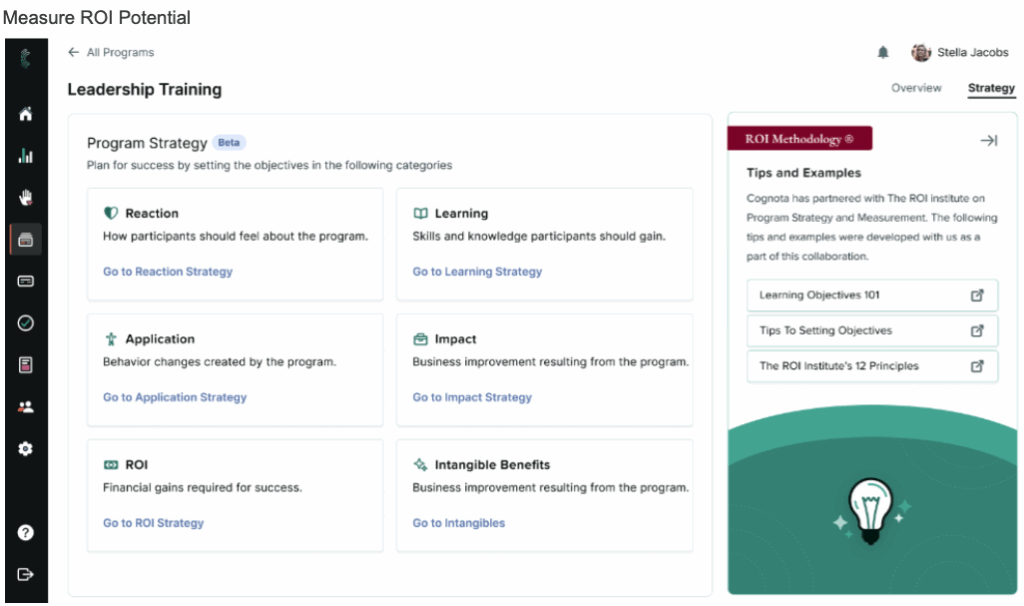
Cognota’s L&D dashboard helps you measure ROI using Performitiv and the ROI Institute methodology.
The platform gives you actionable insights to understand training costs alongside business value before and after delivery. You can track the total program cost, then compare it to expected and measured benefits.
Cognota also includes benchmark analysis using external benchmarks and data points, with an Impact and Value view that connects learning results to financial ROI analysis.
It also provides Insight Charts and an alerts feed that flags meaningful positive or negative changes in results.
Why Cognota Beats Spreadsheets for L&D Dashboards
Spreadsheets work for small teams, but they limit scale, accuracy, and insight. Enterprise L&D teams need a system that handles complex workflows, large data sets, and clear reporting for leaders.
|
What You Need |
Spreadsheets |
Cognota |
|
Up-to-date data |
You must update everything by hand. Data gets old fast. |
Data updates on its own from intake, projects, and evaluations. |
|
Clean and accurate numbers |
Formulas break. Versions change. Mistakes are common. |
Standard fields and workflows keep data clean and correct. |
|
One source of truth |
Many files in many places. Hard to know which one is right. |
One place that links requests, projects, and results. |
|
Clear reports |
Reports take time to rebuild. |
Dashboards update as work moves forward. |
|
Team visibility |
People only see what you share. |
Stakeholders can check status and data in one place. |
|
Benchmarks |
No way to compare your data to others. |
Built-in benchmarks from Performitiv and the ROI Institute. |
|
Forecasting |
No way to forecast or spot risks. |
AI shows trends and risk areas so you can plan. |
|
ROI insight |
Hard to show how training helps the business. |
Impact and Value view links results to ROI. |
|
Scale |
Files break as you grow. |
Built for large teams with many programs. |
|
Security |
Shared drives can cause issues. |
Strong controls for access and data protection. |
Measure Your Performance with L&D Metrics Dashboard
Every L&D team needs actionable insights to make better decisions. A learning and development metrics dashboard turns scattered training data into a clear view of what’s working, what needs attention, and where your budget delivers real value.
Cognota’s built-in dashboards are ideal for companies that manage 5,000+ employees. It helps enterprise L&D teams like the University of Phoenix and Sun Life measure performance metrics, leverage industry benchmarks, and calculate ROI potential.
This allows you to improve program quality, plan capacity with confidence, and maximize returns.
Book a demo to learn how Cognota’s L&D metrics dashboard helps you improve program quality, plan capacity with confidence, and maximize ROI.
FAQs
How do you measure learning and development?
To measure learning and development, you need to track activity metrics, learning outcomes, and on-the-job impact. Use this data to compare business benefits to the cost of training to estimate ROI and prove which programs create real value.
Cognota helps L&D teams measure learning with a complete request-to-ROI chain in one L&D dashboard. Each request is traceable through scoping, resourcing, delivery, and evaluation, so you can connect training activity to outcomes and ROI using consistent, decision-ready data.
What is an employee training dashboard?
An employee training dashboard pulls key training data into one place, such as enrollments, completion rates, attendance, assessment scores, and satisfaction. It helps L&D teams and leaders quickly see what training is happening, how learners perform, and where programs need improvement.
What are the key KPIs for training and development?
Training and development KPIs are metrics that show whether your programs are effective and worth the investment based on your business priorities and ROI goals.
Common L&D KPIs include completion rate, time to complete, assessment pass rate, learner satisfaction, training coverage, and on-the-job impact metrics.