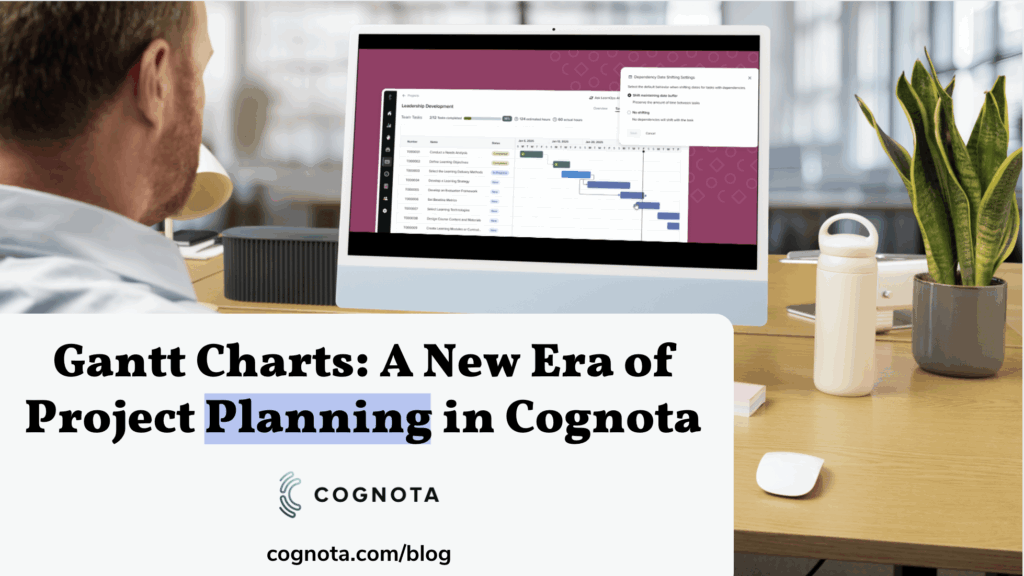
Back in June, we shared the exciting news that Gantt charts were on the horizon for Cognota customers. Since then, our team has been working diligently to bring this powerful project management tool to life. We are still collecting feedback from early access users on the beta version. We’re pleased to announce that Gantt charts will soon be available to all customers.
Why Gantt Charts?
Effective project planning often requires more than just a list of tasks. Learning and development teams need a clear, visual way to understand timelines, spot bottlenecks, and coordinate dependencies across complex projects. Gantt charts provide exactly that:
- A visual roadmap for projects, showing how tasks line up across time.
- The ability to identify overlaps and conflicts before they cause delays.
- A way to manage dependencies, ensuring one shift in schedule doesn’t derail the whole project.
With Gantt charts in Cognota, customers can now take advantage of these benefits directly inside the platform they already use to collaborate and plan.
What Customers Are Saying
When we opened up early access in September, customers jumped in — and their feedback has been clear and encouraging.
- Drag-and-drop feels natural: As one user put it, “I can stretch and move tasks along the timeline without needing extra instruction.”
- Colour coding makes it easier to scan progress: Teams are already finding it helpful to see task status at a glance.
- Overall usability is strong: Another customer told us, “I really like the view of the Gantt chart and I am able to move tasks and change the timelines just fine.”
These early voices validate the direction we’re taking and highlight how the Gantt chart view is making project management more intuitive.
What’s Available Today
With this release, customers in the early access program can:
- View and manage project timelines in an intuitive Gantt chart format.
- Add, edit, and remove dependencies between tasks for better planning.
- Quickly adjust timelines with drag-and-drop simplicity.
And with the streamlined projects list introduced alongside this work, it’s easier than ever to filter, export, and keep track of your projects at a glance.
What’s Next
We’re not stopping here. Based on customer feedback, the team is already working on:
- Dependency shifting: When one task in a chain is moved, related tasks will automatically adjust to maintain a realistic timeline.
- Expanded visibility: Broader views across Programs and individual workloads.
- Performance optimizations and usability features, such as undo and multi-select.
We’re excited for you to explore this feature and see how it transforms your project planning process. As always, we’d love your feedback — it helps us continue to improve Cognota so all learning and development teams can work smarter, not harder.Ready to see how leading organizations are using Cognota’s new Gantt charts to track progress and make smarter decisions? Reach out to your Customer Success Manager or our Support team at support@cognota.com.